Climate Change
- Why I Want Global Warming
- The US Temperature Record 1: Where is the data?
- The US Temperature Record 2: Twelve Data Sets
- The US Temperature Record 3: Stations
- The US Temperature Record 4: Data Flags
- The US Temperature Record 5: Preparing the Data
- The US Temperature Record 6: Extracting annual averages using SQL
- The US Temperature Record 7: Graphing annual data in Excel
- The US Temperature Record 8: Choosing a dataset
- The US Temperature Record 9: Data Cleanup
- The US Temperature Record 10: The Trends
- The US Temperature Record 11: RealClimateTools.com
- More Scientific Fraud Identified
- The Death of Man-Made Climate Change: the last nail is in the coffin, so why didn't it die?
- The Return of Natural Philosophy
- The Stupidity of the Climatists
- Activist Science
Why I Want Global Warming
Global Warming.
A cause of some consternation for almost everyone. Except me, maybe.
You see, I'll all for it.
I grew up and live in a semi-arid region, where the only plants that grow naturally are few and work hard for anything they produce which is never enough to sustain even one person per square mile. So the lack of plant life around me as I grew up is a big influence on how I see what the future might be.
I want plants to grow. Everywhere. All the time.
Right now, they don't. They only grow in certain places. Places that are wet. Riverbanks. Coastlines. Irrigated land.
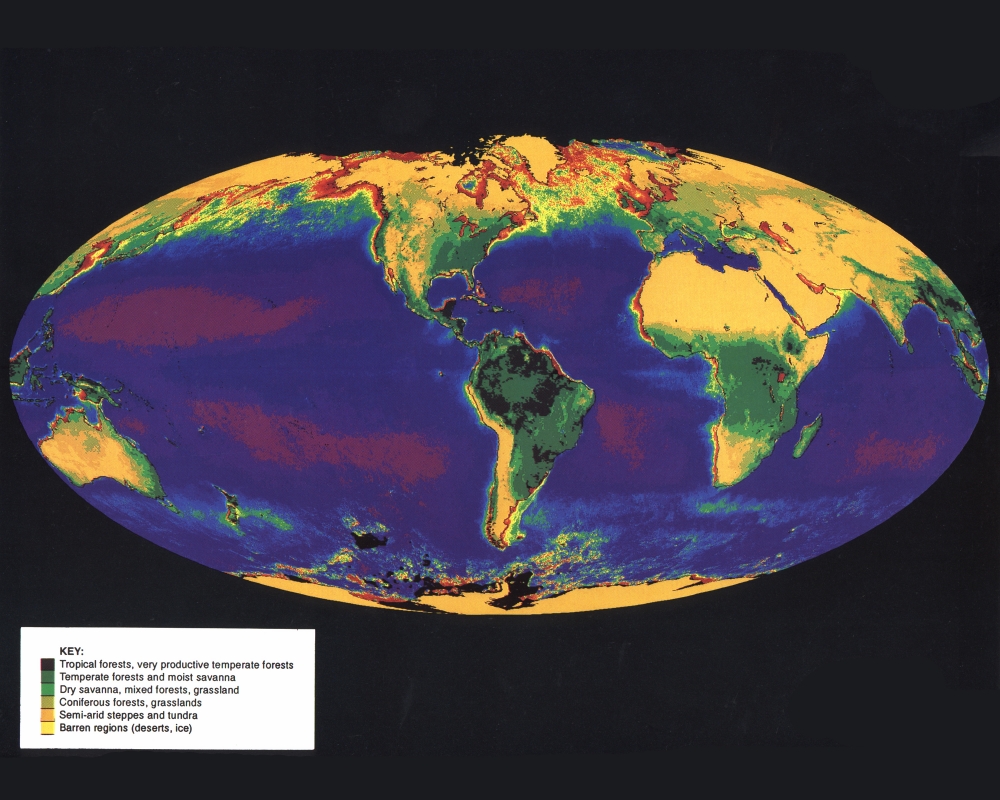
Ever look at a vegetation map? Notice the vast yellow expanses where nothing is growing? That's a problem. A big problem.
It didn't used to be that way. There was a time when plants grew on the surface in sufficient abundance that it was difficult to find dirt. Plants grew on top of plants. It is called the caboniferous period, and existed about 360 - 300 million years ago. That's when the coal beds were deposited. The plants grew in such abundance that the dead plants were buried before they could decay back into carbon dioxide and water, and became coal. There is a lot of coal below ground, and it all used to be plants.
Here's what I want: to recreate, as best we can, the climate of the carboniferous period:
- Average global temperature: 68 °F. Currently: 56 °F
- Oxygen in the atmosphere: 35%. Currently 21%
- Carbon dioxide levels: 1200 ppm. Currently 410 ppm
Carbon dioxide is the key. We need to put it into the atmosphere, which will let global warming heat the oceans, so water will evaporate and also warm the atmosphere (water is a very good greenhouse gas). Then the plants will grow, and oxygen levels will shoot up. The air will be warmer, so we will be wearing less. And that means we need to lose weight, but that will be easy will an abundance of oxygen to help us work out.
As I see it, global warming is a total win for mankind.
The US Temperature Record 1: Where is the data?
I want to examine the US temperature record honestly. We've all seen the "hockey stick" plot of temperatures. Is it real? I'm a scientist, which means there is a part of me that never believes anything I'm told. I want to know for myself. I hate being dependent on believing science. Like a religion. I've already got one, thanks. I'm not keen to adopt any others.
The US climate data repository is kept at the United States Historical Climatology Network (USHCN), https://www.ncdc.noaa.gov/ushcn/data-access. It's kept by National Oceanic and Atmospheric Administration (NOAA), and administered by the National Climatology Data Center (NCDC).
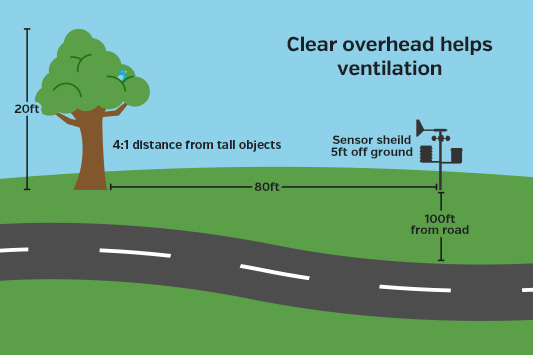
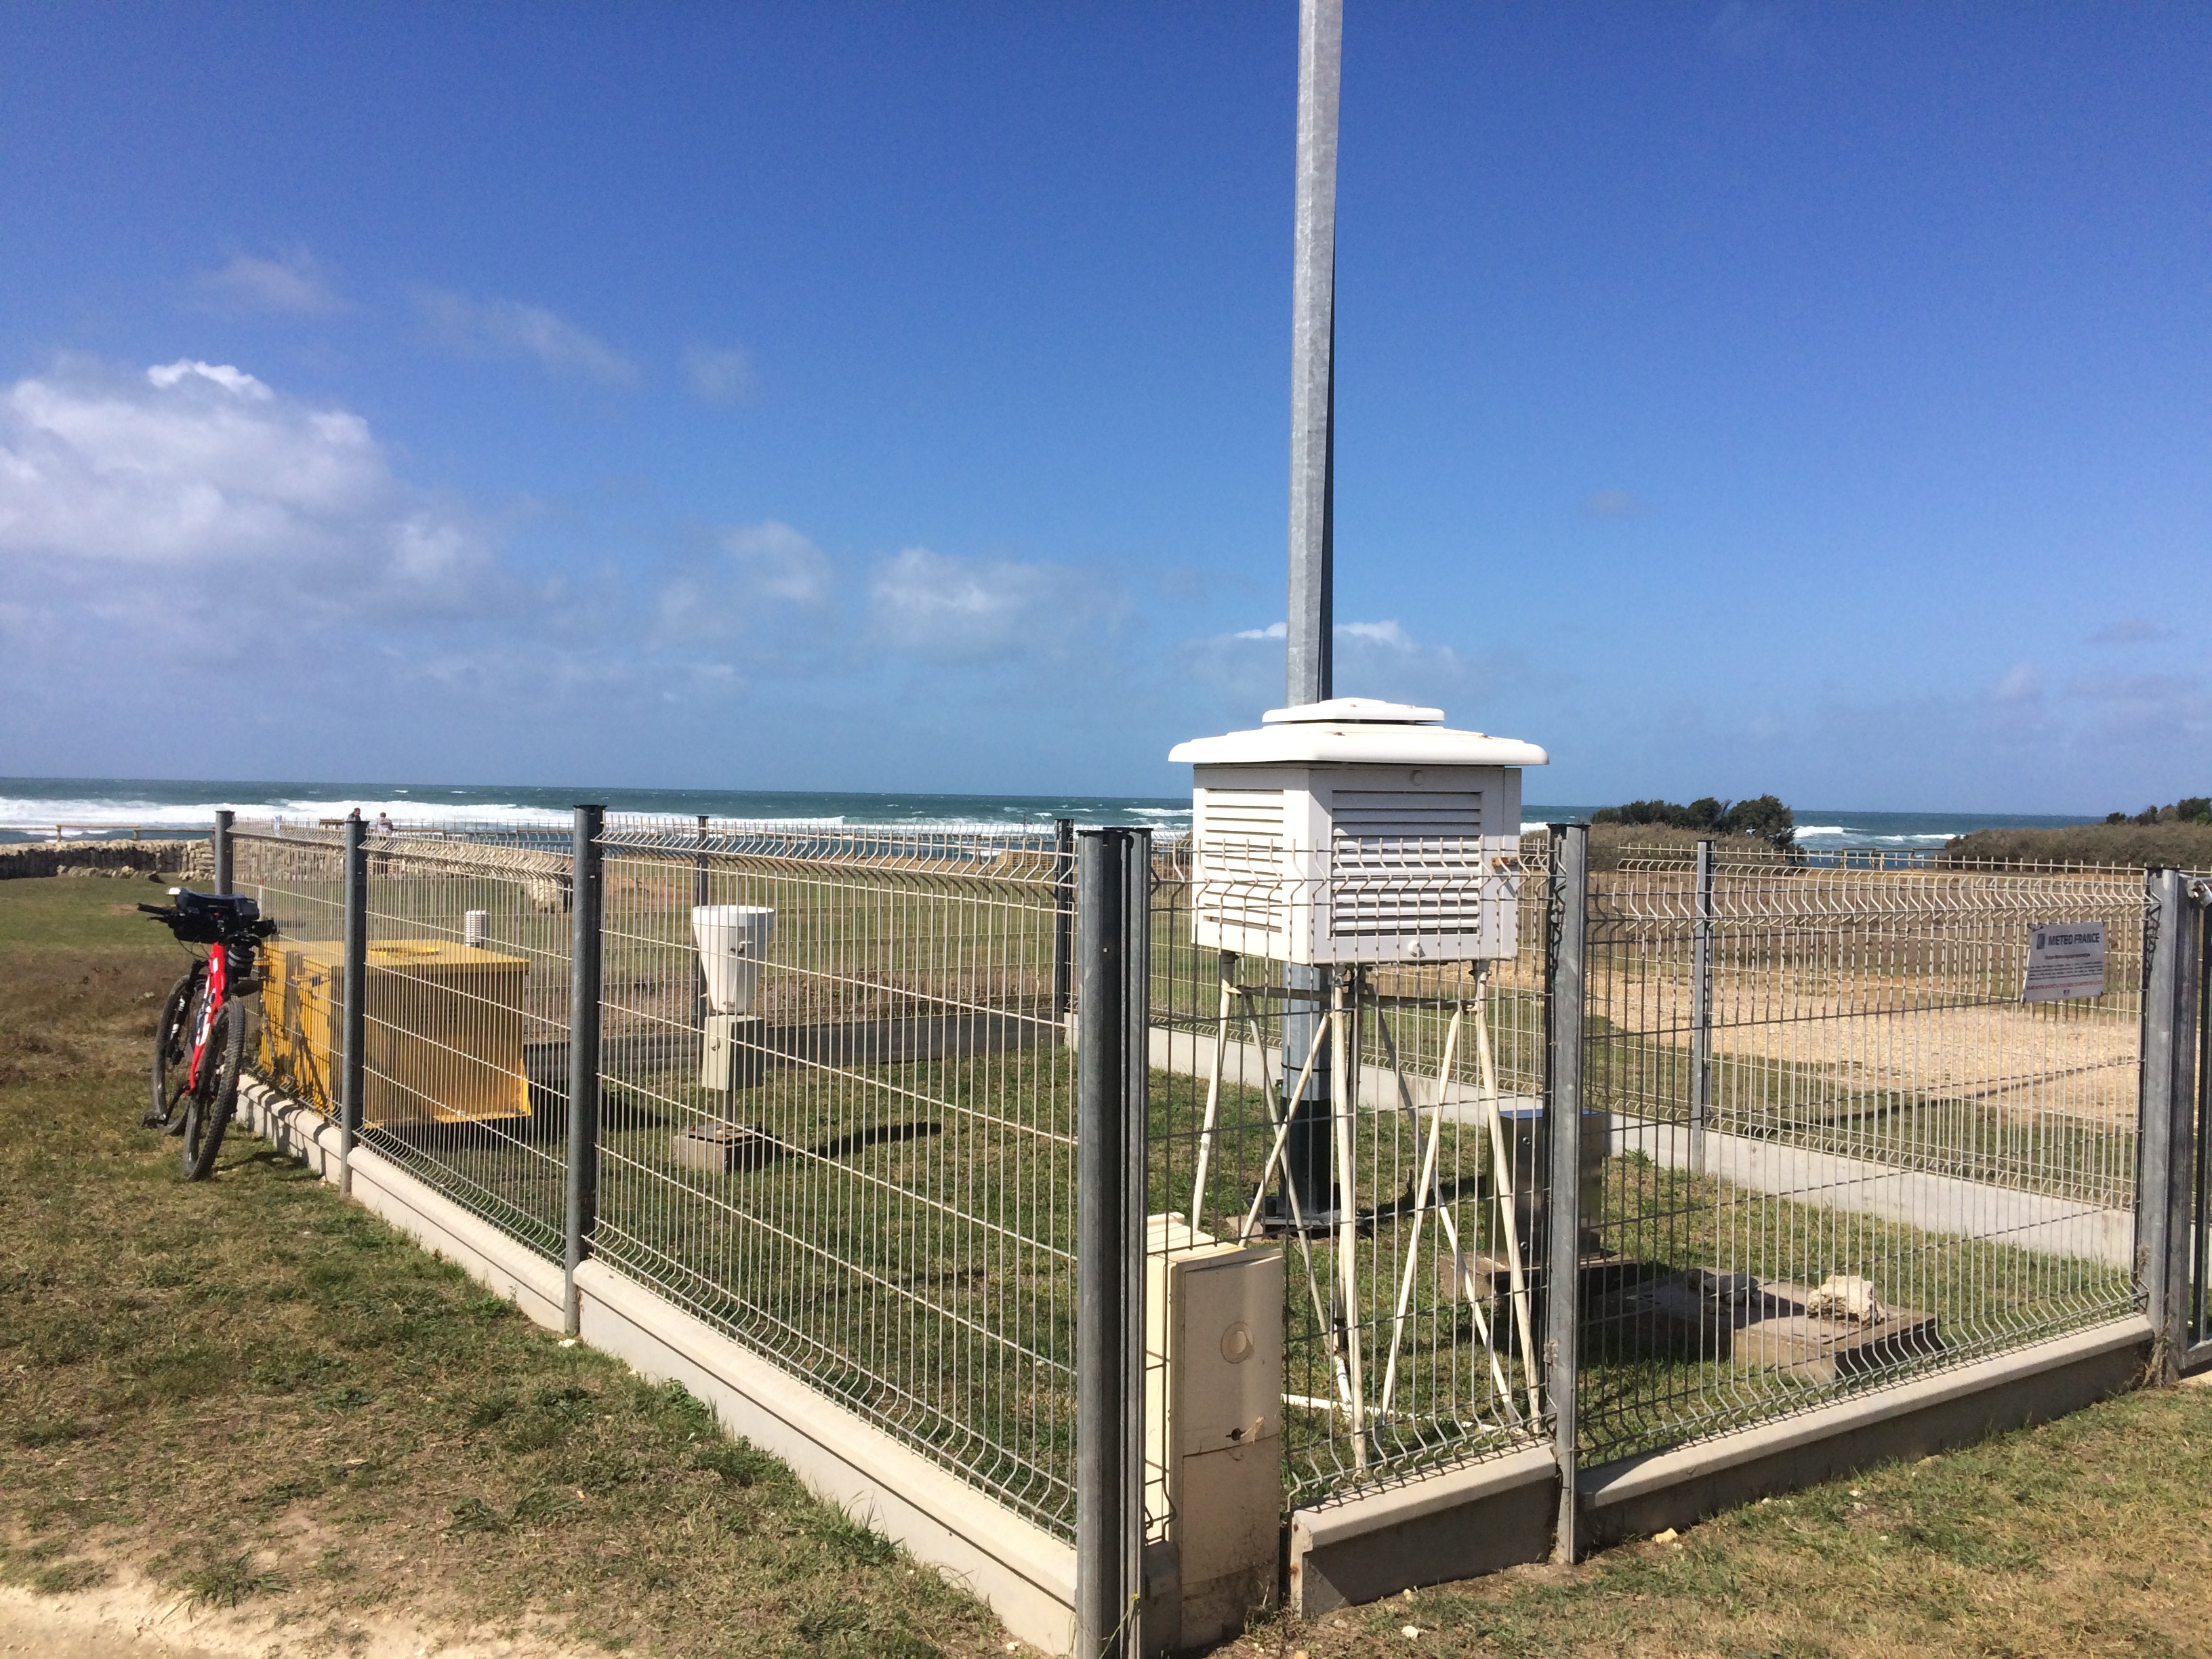
The Network is a set of just under 2000 weather stations which were started back in the Civil War times and added to into the 1950's. All were initially sited well, which means a well-ventilated box above the ground over a grassy field with no structures nor pavements nearby to influence the temperature readings. The thermometers they used were recording thermometers, a U-shaped tube with a bulb at the top of one arm with mercury at the bottom, and small bits of plastic riding on the top of the two arms of mercury. When the temperature went down, gas inside the bulb would contract and draw the mercury up that side, and leave the plastic bit clinging to the glass at its high point representing the coldest temperature of the day. When hot the gas expands, pushing the mercury up in the other column, leaving it's bit of plastic high and dry at the hottest part of the day. Someone come out each day to record the hottest and coldest temperature, then knocks the bits back down by tapping the thermometer. Each month the highs and lows are averaged, and the monthly average is calculated. For most purposes, the monthly average is all that is needed to see general weather trends. The USHCN is a list of the average monthly high, low, and daily average temperatures for each station. It also includes precipitation totals for each month.
If you followed the link above, you'll find the link to the FTP site where the data is kept (https://www.ncei.noaa.gov/pub/data/ushcn/v2.5/) where you'll be confused. What's up with all those different temperature sets? That's in part 2.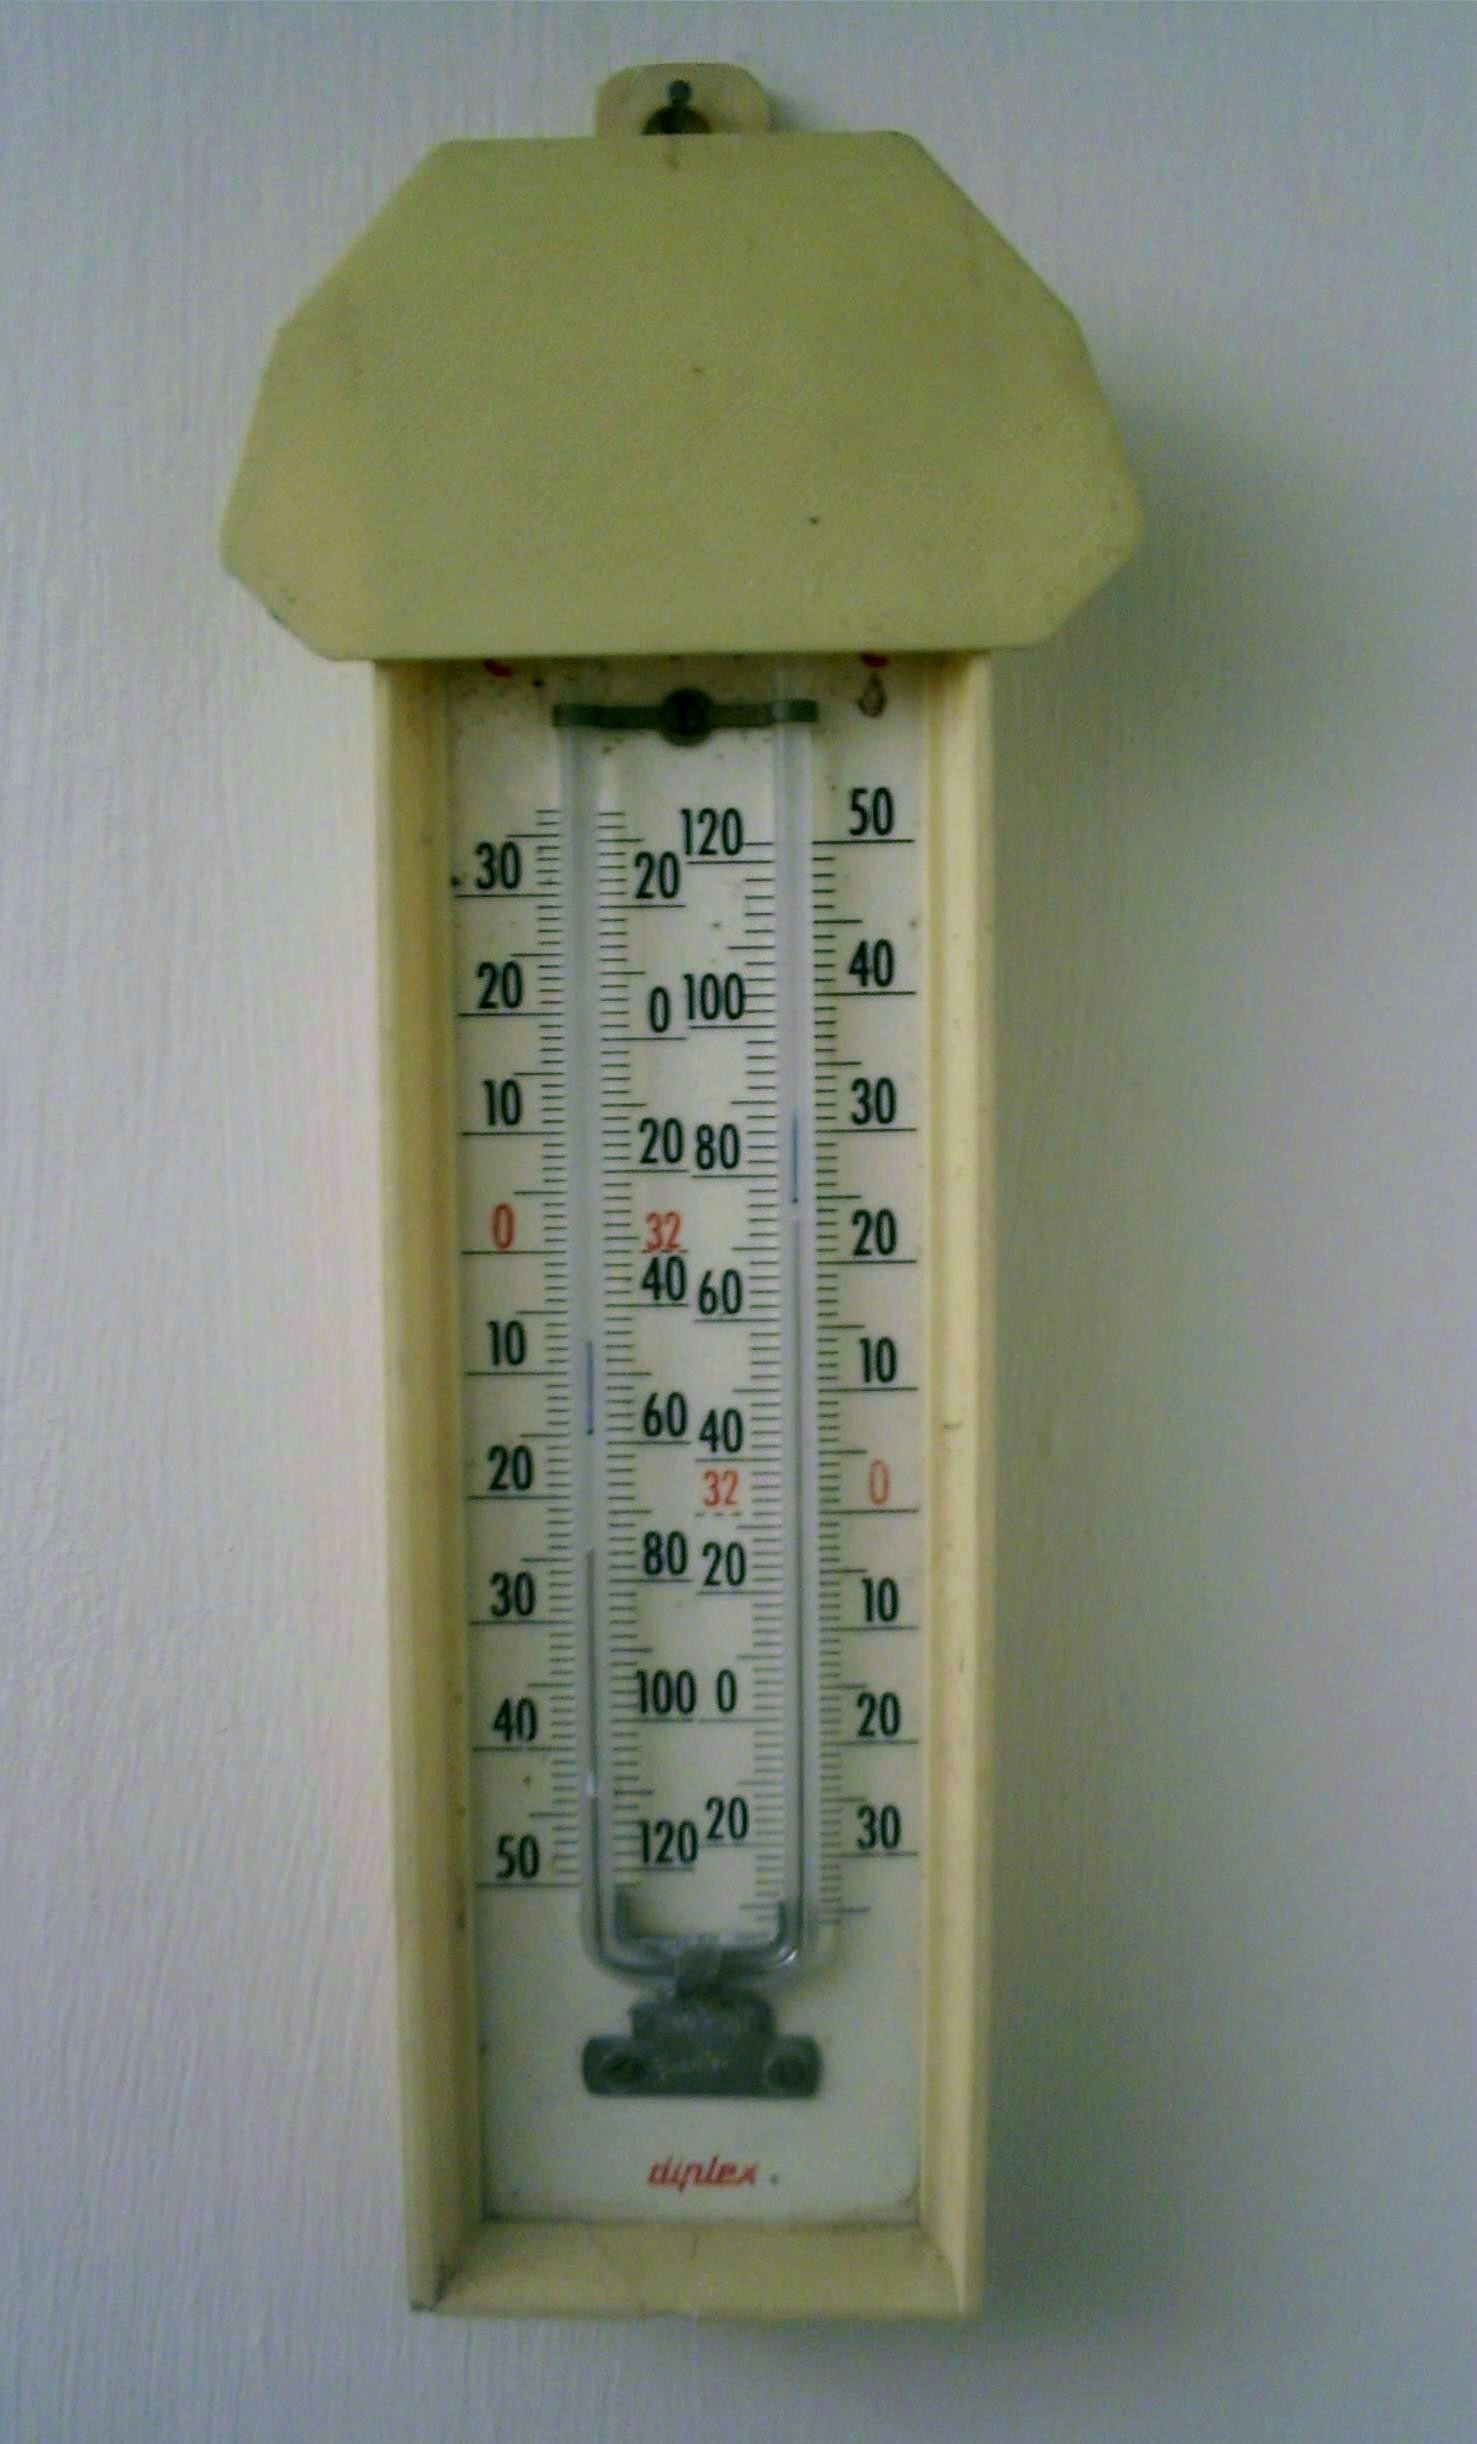
The US Temperature Record 2: Twelve Data Sets
- prcp: precipitation totals for each month
- tavg: the monthly average of the daily average temperatures [(Tmin+Tmax)/2]
- tmax: the monthly average of the daily high temperatures
- tmin: the monthly average of the daily low temperatures
Question: why is the data stored by monthly average, when we have (at least I have) a weather station reporting the weather to national databases every five minutes? Because that's how it was reported until the 1990's. That's how the data was collected for most of the database existence, and they just kept it going. The data is far easier to gather now: no humans involved in reading, recording and resetting the thermometers each day, no emptying the rain trap, no missed days, no averages to calculate by hand, no reports lost in the mail or not sent. You can get an idea what these monthly reports look like from my weather station NOAA data page here.
And for each, three files, or "datasets," are available:
- raw
- tob
- FLs.52j
Twelve data sets in all, supposedly representing one set of measurements. The trouble is those three types of data. Let's see what they are:
raw:
raw data come directly from the reports received. Thermometer readings as they were reported each month.
tob:
Data which has been corrected for time of observation. If the thermometer was observed at 10 am, Tmax represents yesterday's high, while Tmin is that morning's low. The tob correction is supposed to correct for that, which should mean very little to the monthly average and almost nothing to the yearly averages as it shifts the days by one. Scientifically I have a big problem with using this data, as they have changed the primary data. You should never do that. You can adjust the model using the data, but data is the only truth we have in science, and holds a special, inviolable place.
FLs.52j:
This is a far more extreme correction, using what is called the "pairwise homogenization algorithm," the PHA. This is an attempt to level off any variation in the monthly temperature series by comparing each station's monthly averages to those of a nearby station. I have a real problem with this fiddling with the data. They are attempting to solve two problems with one correction: variability in the time series (caused by changes in the measuring equipment or housing), and variability in the spatial series (variability in the temperatures recorded by nearby stations the same day, caused by changes in land use around the station, new roads, even tree growth nearby). It's an attempt to remove variability in the data, which is done so it matches the models better. If there is variability in the data, the model should always reflect that variability; only a fool would change the data to make it match the model better. And this dataset is the tenth ("jth") iteration of the version 2.5 algorithm, meaning they got it wrong nine times in a row but still trust the PHA. Most of us walk away from a bad restaurant after one bout of food poisoning; these guys are eating at the same place ten days straight! Someone needs to explain that to me.
The US Temperature Record 3: Stations
Here are the stations used when calculating the contiguous US temperature trends:
Station ID Lat. Long. Alt.(m) ST Name USH00011084 31.05 -87.05 25.90 AL BREWTON 3 SSE USH00012813 30.54 -87.88 7.00 AL FAIRHOPE 2 NE USH00013160 32.83 -88.13 38.10 AL GAINESVILLE LOCK USH00013511 32.70 -87.58 67.10 AL GREENSBORO USH00013816 31.87 -86.25 132.00 AL HIGHLAND HOME USH00015749 34.74 -87.59 164.60 AL MUSCLE SHOALS AP USH00017157 34.17 -86.81 243.80 AL SAINT BERNARD USH00017304 34.67 -86.05 187.50 AL SCOTTSBORO USH00017366 32.41 -87.01 44.80 AL SELMA USH00018024 33.41 -86.13 136.60 AL TALLADEGA USH00018178 31.54 -87.88 118.90 AL THOMASVILLE USH00018323 31.80 -85.97 165.20 AL TROY USH00018380 33.21 -87.61 51.50 AL TUSCALOOSA ACFD USH00018438 32.01 -85.74 134.10 AL UNION SPRINGS 9 S USH00018469 34.56 -85.61 323.70 AL VALLEY HEAD USH00020080 32.36 -112.86 539.50 AZ AJO USH00021026 33.37 -112.58 271.30 AZ BUCKEYE USH00021248 36.15 -109.53 1709.90 AZ CANYON DE CHELLY USH00021514 33.20 -111.68 434.30 AZ CHANDLER HEIGHTS USH00021614 34.34 -111.69 807.70 AZ CHILDS USH00023160 35.26 -111.74 2239.40 AZ FT VALLEY USH00023596 36.05 -112.15 2068.10 AZ GRAND CANYON NP 2 USH00024089 34.90 -110.15 1549.90 AZ HOLBROOK USH00024645 35.20 -114.01 1078.70 AZ KINGMAN #2 USH00024849 36.86 -111.60 978.40 AZ LEES FERRY USH00025512 33.40 -110.87 1085.10 AZ MIAMI USH00026250 34.15 -114.28 128.00 AZ PARKER USH00026353 31.93 -109.83 1325.90 AZ PEARCE SUNSITES USH00026796 34.57 -112.43 1586.50 AZ PRESCOTT USH00027281 33.67 -111.15 672.10 AZ ROOSEVELT 1 WNW USH00027370 33.08 -111.74 391.70 AZ SACATON USH00027390 32.81 -109.68 900.40 AZ SAFFORD AGRICULTRL CTR USH00027435 34.51 -109.40 1764.80 AZ SAINT JOHNS USH00027716 35.33 -112.87 1600.20 AZ SELIGMAN USH00028619 31.70 -110.05 1405.10 AZ TOMBSTONE USH00028815 32.22 -110.95 742.20 AZ TUCSON WFO USH00029271 33.81 -109.98 1560.60 AZ WHITERIVER 1 SW USH00029287 33.97 -112.74 638.60 AZ WICKENBURG USH00029359 35.24 -112.19 2057.40 AZ WILLIAMS USH00029652 32.61 -114.63 58.20 AZ YUMA CITRUS STN USH00030936 34.88 -91.21 56.40 AR BRINKLEY USH00031596 35.08 -92.42 96.00 AR CONWAY USH00031632 36.41 -90.58 91.40 AR CORNING USH00032356 36.41 -93.79 432.80 AR EUREKA SPRINGS 3 WNW USH00032444 36.10 -94.17 387.10 AR FAYETTEVILLE EXP STN USH00032930 36.42 -94.44 384.00 AR GRAVETTE USH00034572 36.49 -91.53 153.00 AR MAMMOTH SPRING USH00034756 34.57 -94.24 344.40 AR MENA USH00035186 35.60 -91.27 69.50 AR NEWPORT USH00035512 35.51 -93.86 253.00 AR OZARK 2 USH00035754 34.22 -92.01 65.50 AR PINE BLUFF USH00035820 36.26 -90.96 96.00 AR POCAHONTAS 1 USH00035908 33.82 -93.38 93.90 AR PRESCOTT 2 NNW USH00036253 33.81 -91.27 45.70 AR ROHWER 2 NNE USH00036928 35.30 -93.63 152.40 AR SUBIACO USH00040693 37.87 -122.25 94.50 CA BERKELEY USH00040924 33.61 -114.59 81.70 CA BLYTHE USH00041048 32.95 -115.55 -30.50 CA BRAWLEY 2 SW USH00041614 41.53 -120.17 1423.40 CA CEDARVILLE USH00041715 39.69 -121.82 56.40 CA CHICO UNIV FARM USH00041758 32.64 -117.08 17.10 CA CHULA VISTA USH00041912 39.09 -120.94 725.40 CA COLFAX USH00042239 32.98 -116.58 1414.30 CA CUYAMACA USH00042294 38.53 -121.77 18.30 CA DAVIS 2 WSW EXP USH00042319 36.46 -116.86 -59.10 CA DEATH VALLEY USH00042728 38.33 -120.67 217.90 CA ELECTRA P H USH00042910 40.80 -124.16 6.10 CA EUREKA WFO WOODLEY IS USH00042941 34.70 -118.42 932.70 CA FAIRMONT USH00043161 39.50 -123.75 37.50 CA FT BRAGG 5 N USH00043257 36.78 -119.71 101.50 CA FRESNO YOSEMITE AP USH00043747 36.32 -119.63 74.70 CA HANFORD 1 S USH00043761 41.80 -123.37 341.40 CA HAPPY CAMP RS USH00043875 38.61 -122.87 32.90 CA HEALDSBURG USH00044232 36.79 -118.20 1204.00 CA INDEPENDENCE USH00044259 33.70 -116.21 -6.40 CA INDIO FIRE STN USH00044713 39.31 -120.63 1571.50 CA LAKE SPAULDING USH00044890 36.38 -119.02 156.40 CA LEMON COVE USH00044997 37.69 -121.76 146.30 CA LIVERMORE USH00045032 38.10 -121.28 12.20 CA LODI USH00045385 39.14 -121.58 17.40 CA MARYSVILLE USH00045532 37.28 -120.51 46.60 CA MERCED USH00045983 41.32 -122.30 1094.20 CA MT SHASTA USH00046074 38.27 -122.26 10.70 CA NAPA STATE HOSPITAL USH00046118 34.76 -114.61 271.30 CA NEEDLES AP USH00046175 33.60 -117.88 3.00 CA NEWPORT BEACH HARBOR USH00046399 34.44 -119.22 227.10 CA OJAI USH00046506 39.74 -122.19 77.40 CA ORLAND USH00046508 41.30 -123.53 122.80 CA ORLEANS USH00046719 34.14 -118.14 263.30 CA PASADENA USH00046730 35.62 -120.68 213.40 CA PASO ROBLES USH00046826 38.25 -122.60 6.10 CA PETALUMA AP USH00047195 39.93 -120.94 1042.40 CA QUINCY USH00047304 40.51 -122.29 151.50 CA REDDING MUNI AP USH00047306 34.05 -117.18 401.70 CA REDLANDS USH00047851 35.30 -120.66 96.00 CA SAN LUIS OBISPO POLY USH00047902 34.41 -119.68 1.50 CA SANTA BARBARA USH00047916 36.99 -121.99 39.60 CA SANTA CRUZ USH00047965 38.43 -122.69 53.00 CA SANTA ROSA USH00048702 40.41 -120.66 1275.30 CA SUSANVILLE 2SW USH00048758 39.16 -120.14 1898.90 CA TAHOE CITY USH00048839 35.02 -118.74 434.30 CA TEJON RANCHO USH00049087 33.70 -117.75 71.60 CA TUSTIN IRVINE RCH USH00049122 39.14 -123.21 193.90 CA UKIAH USH00049200 38.39 -121.96 33.50 CA VACAVILLE USH00049452 35.59 -119.35 105.20 CA WASCO USH00049490 40.72 -122.93 599.80 CA WEAVERVILLE USH00049699 39.52 -122.30 71.00 CA WILLOWS 6 W USH00049855 37.75 -119.58 1224.70 CA YOSEMITE PARK HQ USH00049866 41.70 -122.64 800.10 CA YREKA USH00050848 39.99 -105.26 1671.50 CO BOULDER USH00051294 38.46 -105.22 1635.60 CO CANON CITY USH00051528 39.22 -105.27 2097.00 CO CHEESMAN USH00051564 38.82 -102.34 1295.40 CO CHEYENNE WELLS USH00051741 39.24 -107.96 1822.70 CO COLLBRAN USH00052184 37.67 -106.32 2396.90 CO DEL NORTE 2E USH00052281 39.62 -106.03 2763.00 CO DILLON 1 E USH00052446 38.47 -102.78 1284.70 CO EADS USH00053005 40.61 -105.13 1525.20 CO FT COLLINS USH00053038 40.26 -103.81 1328.60 CO FT MORGAN USH00053146 39.16 -108.73 1378.90 CO FRUITA USH00053662 38.52 -106.96 2323.80 CO GUNNISON 3SW USH00053951 37.77 -107.10 2757.80 CO HERMIT 7 ESE USH00054076 38.04 -102.12 1033.30 CO HOLLY USH00054770 38.09 -102.63 1105.50 CO LAMAR USH00054834 38.06 -103.21 1185.70 CO LAS ANIMAS USH00055322 37.17 -105.93 2343.90 CO MANASSA USH00055722 38.48 -107.87 1764.50 CO MONTROSE #2 USH00057167 38.03 -103.69 1271.00 CO ROCKY FORD 2 SE USH00057337 38.08 -106.14 2347.30 CO SAGUACHE USH00057936 40.48 -106.82 2094.00 CO STEAMBOAT SPRINGS USH00058204 37.94 -107.87 2643.20 CO TELLURIDE 4WNW USH00058429 37.17 -104.48 1837.90 CO TRINIDAD USH00059243 40.05 -102.21 1121.70 CO WRAY USH00062658 41.95 -73.36 167.60 CT FALLS VILLAGE USH00063207 41.35 -72.03 12.20 CT GROTON USH00067970 41.12 -73.54 57.90 CT STAMFORD 5 N USH00068138 41.79 -72.22 198.10 CT STORRS USH00072730 39.25 -75.51 9.10 DE DOVER USH00073595 38.81 -75.57 13.70 DE GREENWOOD 2NE USH00075915 38.89 -75.42 10.70 DE MILFORD 2 SE USH00076410 39.66 -75.75 27.40 DE NEWARK UNIV FARM USH00079605 39.77 -75.54 82.30 DE WILMINGTON PORTER RES USH00080211 29.72 -85.02 6.10 FL APALACHICOLA AP USH00080228 27.21 -81.87 9.10 FL ARCADIA USH00080478 27.89 -81.84 38.10 FL BARTOW USH00080611 26.69 -80.67 6.10 FL BELLE GLADE USH00082220 30.72 -86.09 74.70 FL DE FUNIAK SPRINGS 1 USH00082850 25.84 -81.38 1.50 FL EVERGLADES USH00082915 29.75 -81.53 1.50 FL FEDERAL POINT USH00082944 30.65 -81.46 4.00 FL FERNANDINA BEACH USH00083163 26.10 -80.20 4.90 FL FT LAUDERDALE USH00083186 26.58 -81.86 4.60 FL FT MYERS PAGE FLD USH00083207 27.46 -80.35 7.60 FL FT PIERCE USH00084289 28.80 -82.31 12.20 FL INVERNESS 3 SE USH00084570 24.55 -81.75 1.20 FL KEY WEST INTL AP USH00084731 30.18 -82.59 59.40 FL LAKE CITY 2 E USH00085275 30.45 -83.41 36.60 FL MADISON USH00086414 29.08 -82.07 22.90 FL OCALA USH00086997 30.47 -87.18 34.10 FL PENSACOLA RGNL AP USH00087020 25.58 -80.43 3.00 FL PERRINE 4W USH00087851 28.33 -82.26 57.90 FL SAINT LEO USH00088758 30.39 -84.35 16.80 FL TALLAHASSEE WSO AP USH00088824 28.15 -82.76 2.40 FL TARPON SPGS SEWAGE PL USH00088942 28.62 -80.81 1.50 FL TITUSVILLE USH00090140 31.53 -84.14 54.90 GA ALBANY 3 SE USH00090586 30.82 -84.61 57.90 GA BAINBRIDGE INTL PAPER USH00091340 31.16 -81.50 4.00 GA BRUNSWICK USH00091500 31.19 -84.20 53.30 GA CAMILLA 3SE USH00092318 33.59 -83.84 234.40 GA COVINGTON USH00092475 34.52 -83.99 475.50 GA DAHLONEGA USH00092966 32.20 -83.20 121.90 GA EASTMAN 1 W USH00093621 34.30 -83.86 356.60 GA GAINESVILLE USH00093754 31.98 -81.95 61.00 GA GLENNVILLE 3NW USH00094170 33.28 -83.46 74.70 GA HAWKINSVILLE USH00095874 33.08 -83.24 112.20 GA MILLEDGEVILLE USH00095882 32.87 -81.96 59.40 GA MILLEN 4 N USH00096335 33.45 -84.81 272.50 GA NEWNAN 5N USH00097276 30.78 -83.56 56.40 GA QUITMAN 2 NW USH00097600 34.24 -85.15 200.90 GA ROME USH00097847 32.13 -81.21 14.00 GA SAVANNAH INTL AP USH00098535 32.68 -84.51 195.10 GA TALBOTTON USH00098703 31.44 -83.47 115.80 GA TIFTON USH00098740 34.57 -83.33 308.50 GA TOCCOA USH00099141 33.40 -82.62 149.40 GA WARRENTON USH00099157 33.72 -82.70 189.00 GA WASHINGTON 2 ESE USH00099186 31.25 -82.31 44.20 GA WAYCROSS 4 NE USH00099291 32.86 -85.18 175.30 GA WEST POINT USH00100010 42.95 -112.82 1342.60 ID ABERDEEN EXP STN USH00100448 43.59 -115.92 986.00 ID ARROWROCK DAM USH00100470 44.04 -111.27 1588.60 ID ASHTON 1N USH00100803 42.33 -111.38 1817.80 ID BERN USH00101408 44.57 -116.67 807.70 ID CAMBRIDGE USH00101956 47.67 -116.80 650.10 ID COEUR D'ALENE USH00102845 46.50 -116.32 303.30 ID DWORSHAK FISH HATCHERY USH00103143 46.09 -115.53 475.50 ID FENN RS USH00103631 42.94 -115.32 751.60 ID GLENNS FERRY USH00103732 42.58 -111.72 1691.60 ID GRACE USH00104140 42.59 -114.13 1237.50 ID HAZELTON USH00104295 42.35 -114.57 1379.20 ID HOLLISTER USH00104670 42.73 -114.51 1140.00 ID JEROME USH00104831 47.53 -116.12 707.10 ID KELLOGG USH00104845 43.68 -114.36 1795.30 ID KETCHUM RS USH00105241 46.37 -117.01 437.70 ID LEWISTON AP USH00105275 42.12 -111.31 1806.20 ID LIFTON PUMPING STN USH00105462 43.91 -113.63 1797.40 ID MACKAY LOST RIVER RS USH00105559 42.14 -112.28 1362.50 ID MALAD CITY USH00105685 44.56 -113.89 1539.20 ID MAY 2SSE USH00106152 46.72 -116.96 810.80 ID MOSCOW U OF I USH00106305 43.60 -116.57 752.90 ID NAMPA SUGAR FACTORY USH00106388 44.96 -116.28 1179.60 ID NEW MEADOWS RS USH00106542 42.23 -113.89 1389.60 ID OAKLEY USH00106891 44.07 -116.92 655.30 ID PAYETTE USH00107264 48.99 -116.50 541.00 ID PORTHILL USH00107386 48.35 -116.83 725.40 ID PRIEST RIVER EXP STN USH00108080 45.18 -113.90 1198.20 ID SALMON-KSRA USH00108137 48.29 -116.55 640.10 ID SANDPOINT EXP STN USH00110072 41.19 -90.74 219.50 IL ALEDO USH00110187 37.48 -89.23 195.10 IL ANNA 2 NNE USH00110338 41.78 -88.30 201.20 IL AURORA USH00111280 39.28 -89.87 189.30 IL CARLINVILLE USH00111436 39.47 -88.16 198.10 IL CHARLESTON USH00112140 40.13 -87.64 170.10 IL DANVILLE USH00112193 39.82 -88.95 189.00 IL DECATUR WTP USH00112348 41.84 -89.50 213.40 IL DIXON 1 NW USH00112483 37.98 -89.19 128.00 IL DU QUOIN 4 SE USH00113335 41.17 -90.03 246.90 IL GALVA USH00113879 37.74 -88.52 111.30 IL HARRISBURG USH00114108 39.15 -89.48 192.00 IL HILLSBORO USH00114198 40.47 -87.65 216.40 IL HOOPESTON 1 NE USH00114442 39.73 -90.19 185.90 IL JACKSONVILLE 2E USH00114823 40.58 -90.96 210.30 IL LA HARPE USH00115079 40.15 -89.33 177.70 IL LINCOLN USH00115326 42.29 -88.64 248.40 IL MARENGO USH00115515 38.08 -88.54 135.90 IL MCLEANSBORO USH00115712 40.91 -89.03 228.60 IL MINONK USH00115768 40.92 -90.63 227.10 IL MONMOUTH USH00115833 41.80 -89.97 183.80 IL MORRISON USH00115901 42.09 -89.98 195.10 IL MT CARROLL USH00115943 38.34 -88.85 149.40 IL MT VERNON 3 NE USH00116446 38.70 -88.08 146.30 IL OLNEY 2S USH00116526 41.32 -88.91 160.00 IL OTTAWA 5SW USH00116558 39.00 -87.62 140.20 IL PALESTINE USH00116579 39.37 -89.02 213.40 IL PANA 3E USH00116610 39.63 -87.69 207.30 IL PARIS WTR WKS USH00116738 39.80 -90.82 198.10 IL PERRY 6 NW USH00116910 40.88 -88.63 198.10 IL PONTIAC USH00117551 40.11 -90.56 201.20 IL RUSHVILLE USH00118147 38.11 -89.71 163.10 IL SPARTA 1 W USH00118740 40.08 -88.24 219.80 IL URBANA USH00118916 41.55 -89.59 210.30 IL WALNUT USH00119241 39.44 -90.37 176.80 IL WHITE HALL 1 E USH00119354 39.43 -88.59 210.30 IL WINDSOR USH00120177 40.11 -85.71 257.60 IN ANDERSON SEWAGE PLT USH00120200 41.63 -84.98 307.80 IN ANGOLA USH00120676 40.66 -84.93 265.20 IN BERNE WWTP USH00120784 39.17 -86.52 253.00 IN BLOOMINGTON IN UNIV USH00121030 39.42 -85.01 192.00 IN BROOKVILLE USH00121229 39.86 -85.18 304.80 IN CAMBRIDGE CITY 3 N USH00121425 38.48 -85.70 167.60 IN CHARLESTOWN 5 NNW USH00121747 39.19 -85.92 189.30 IN COLUMBUS USH00121873 40.00 -86.80 256.00 IN CRAWFORDSVILLE 6 SE USH00122149 40.61 -86.66 169.50 IN DELPHI 2 N USH00123418 41.55 -85.88 266.70 IN GOSHEN 3SW USH00123513 39.64 -86.87 224.00 IN GREENCASTLE 1 W USH00123527 39.78 -85.76 263.70 IN GREENFIELD USH00124008 41.54 -87.28 195.10 IN HOBART 2 WNW USH00124181 40.85 -85.49 221.00 IN HUNTINGTON USH00124837 41.61 -86.72 257.60 IN LAPORTE USH00125237 38.73 -85.39 140.20 IN MADISON SEWAGE PLT USH00125337 40.58 -85.65 240.80 IN MARION 2 N USH00126001 37.92 -87.89 108.80 IN MT VERNON USH00126580 38.88 -86.55 198.10 IN OOLITIC PURDUE EX FRM USH00126705 38.55 -86.48 170.70 IN PAOLI USH00127125 38.35 -87.59 146.30 IN PRINCETON 1 W USH00127298 40.93 -87.15 198.10 IN RENSSELAER USH00127482 41.06 -86.20 234.70 IN ROCHESTER USH00127522 39.75 -87.22 211.20 IN ROCKVILLE USH00127646 39.60 -85.45 292.60 IN RUSHVILLE USH00127755 38.61 -86.08 243.80 IN SALEM USH00127875 38.68 -85.78 173.70 IN SCOTTSBURG USH00127935 38.98 -85.98 173.70 IN SEYMOUR 2 N USH00128036 38.55 -86.79 154.20 IN SHOALS 8 S USH00129080 38.74 -85.07 150.90 IN VEVAY USH00129113 38.73 -87.48 137.20 IN VINCENNES 5 NE USH00129253 38.64 -87.19 152.40 IN WASHINGTON 1 W USH00129511 41.19 -87.05 202.70 IN WHEATFIELD USH00129557 39.99 -86.35 289.00 IN WHITESTOWN USH00129670 41.02 -86.58 210.30 IN WINAMAC 2SSE USH00130112 41.06 -92.78 268.20 IA ALBIA 3 NNE USH00130133 43.06 -94.30 377.60 IA ALGONA 3 W USH00130600 41.88 -92.27 246.90 IA BELLE PLAINE USH00131402 43.07 -92.67 309.10 IA CHARLES CITY USH00131533 40.72 -95.01 298.70 IA CLARINDA USH00131635 41.79 -90.26 178.30 IA CLINTON #1 USH00132724 43.43 -94.82 396.80 IA ESTHERVILLE 2 N USH00132789 41.02 -91.95 225.60 IA FAIRFIELD USH00132864 42.85 -91.81 344.40 IA FAYETTE USH00132977 43.28 -93.63 396.20 IA FOREST CITY 2 NNE USH00132999 42.58 -94.20 347.50 IA FORT DODGE 5NNW USH00134063 41.36 -93.64 287.10 IA INDIANOLA 2W USH00134142 42.51 -93.25 344.40 IA IOWA FALLS USH00134735 42.78 -96.14 364.20 IA LE MARS USH00134894 41.63 -95.78 301.80 IA LOGAN USH00135769 40.70 -94.24 359.70 IA MT AYR USH00135796 40.94 -91.56 222.50 IA MT PLEASANT 1 SSW USH00135952 43.04 -92.31 349.90 IA NEW HAMPTON USH00137147 43.43 -96.16 411.50 IA ROCK RAPIDS USH00137161 42.39 -94.62 364.20 IA ROCKWELL CITY USH00137979 42.63 -95.16 434.30 IA STORM LAKE 2 E USH00138296 42.03 -92.58 289.30 IA TOLEDO 3N USH00138688 41.28 -91.70 210.30 IA WASHINGTON USH00140264 37.15 -98.02 408.40 KS ANTHONY USH00140365 37.19 -99.76 600.50 KS ASHLAND USH00140405 39.57 -95.11 288.00 KS ATCHISON USH00141704 37.27 -99.32 634.90 KS COLDWATER USH00141740 37.17 -94.83 275.80 KS COLUMBUS USH00141867 38.67 -96.50 402.30 KS COUNCIL GROVE LAKE USH00142401 37.81 -96.84 393.20 KS EL DORADO USH00142459 38.72 -98.22 466.30 KS ELLSWORTH USH00142835 37.84 -94.70 257.60 KS FT SCOTT USH00143527 38.85 -99.33 612.60 KS HAYS 1 S USH00143810 39.67 -95.52 313.90 KS HORTON USH00143954 37.23 -95.70 245.40 KS INDEPENDENCE USH00144087 38.19 -99.91 740.70 KS JETMORE 8NNW USH00144464 37.94 -101.24 913.80 KS LAKIN USH00144530 38.18 -99.09 608.10 KS LARNED USH00144559 38.95 -95.25 306.30 KS LAWRENCE USH00144588 39.32 -94.91 265.20 KS LEAVENWORTH USH00144695 37.02 -100.92 863.80 KS LIBERAL USH00144972 39.19 -96.58 324.60 KS MANHATTAN USH00145152 38.37 -97.60 463.30 KS MCPHERSON USH00145173 37.27 -98.58 448.10 KS MEDICINE LODGE USH00145363 39.12 -97.70 402.90 KS MINNEAPOLIS USH00145856 39.74 -99.83 719.30 KS NORTON 9SSE USH00145906 39.81 -100.53 795.50 KS OBERLIN USH00145972 38.88 -94.76 321.60 KS OLATHE 3E USH00146128 38.61 -95.28 280.10 KS OTTAWA USH00147093 39.76 -101.80 1024.70 KS SAINT FRANCIS USH00147271 38.48 -100.91 905.30 KS SCOTT CITY USH00147305 37.13 -96.18 274.30 KS SEDAN USH00147542 39.77 -98.77 542.50 KS SMITH CTR USH00148495 39.02 -99.88 749.80 KS WAKEENEY USH00150254 38.45 -82.61 170.70 KY ASHLAND USH00150381 36.88 -83.88 301.80 KY BARBOURVILLE USH00150619 37.57 -84.29 326.10 KY BEREA COLLEGE USH00150909 36.96 -86.42 160.90 KY BOWLING GREEN RGNL AP USH00152791 38.11 -83.55 207.30 KY FARMERS 2 S USH00153028 38.20 -84.88 140.80 KY FRANKFORT DOWNTOWN USH00153430 37.25 -85.50 179.80 KY GREENSBURG USH00153762 37.75 -87.64 136.90 KY HENDERSON 8 SSW USH00153994 36.84 -87.52 158.50 KY HOPKINSVILLE USH00154703 37.51 -86.28 189.00 KY LEITCHFIELD 2 N USH00157324 38.20 -85.20 222.50 KY SHELBYVILLE 1 E USH00158709 36.73 -84.15 286.50 KY WILLIAMSBURG USH00158714 38.65 -84.61 286.50 KY WILLIAMSTOWN 3 W USH00160098 31.32 -92.46 26.50 LA ALEXANDRIA USH00160205 30.70 -90.52 51.80 LA AMITE USH00160537 32.76 -92.00 45.70 LA BASTROP USH00160549 30.53 -91.14 19.50 LA BATON ROUGE METRO AP USH00161287 30.95 -92.17 24.40 LA BUNKIE USH00161411 32.51 -92.34 54.90 LA CALHOUN RSCH STN USH00162151 30.52 -90.11 12.20 LA COVINGTON 4 NNW USH00162534 30.07 -91.02 9.10 LA DONALDSONVILLE 4 SW USH00163313 29.82 -91.54 3.70 LA FRANKLIN 3 NW USH00163800 30.41 -92.04 16.80 LA GRAND COTEAU USH00164407 29.58 -90.73 4.60 LA HOUMA USH00164700 30.20 -92.66 7.60 LA JENNINGS USH00165026 30.20 -91.98 11.60 LA LAFAYETTE FCWOS USH00166664 29.91 -90.13 6.10 LA NEW ORLEANS AUDUBON USH00167344 32.90 -93.79 88.40 LA PLAIN DEALING 4 W USH00168163 31.94 -91.23 23.80 LA ST JOSEPH 3 N USH00169013 29.77 -90.78 4.60 LA THIBODAUX 3 ESE USH00169806 32.09 -91.70 24.40 LA WINNSBORO 5 SSE USH00170100 44.37 -68.25 143.30 ME ACADIA NP USH00170814 45.66 -69.81 323.10 ME BRASSUA DAM USH00171628 44.91 -69.24 90.50 ME CORINNA USH00172426 44.90 -66.99 25.90 ME EASTPORT USH00172765 44.68 -70.15 128.00 ME FARMINGTON USH00173046 44.22 -69.78 42.70 ME GARDINER USH00173944 46.20 -67.84 118.90 ME HOULTON 5N USH00174566 44.10 -70.21 54.90 ME LEWISTON USH00175304 45.65 -68.70 109.70 ME MILLINOCKET USH00176905 43.64 -70.30 13.70 ME PORTLAND JETPORT USH00176937 46.65 -68.00 182.60 ME PRESQUE ISLE USH00179891 45.15 -67.40 42.70 ME WOODLAND USH00180700 39.03 -76.93 44.20 MD BELTSVILLE USH00181385 38.56 -76.06 3.00 MD CAMBRIDGE WATER TRMT P USH00181750 39.21 -76.05 12.20 MD CHESTERTOWN USH00182282 39.64 -78.75 222.50 MD CUMBERLAND 2 USH00182523 38.88 -75.80 14.90 MD DENTON 2 E USH00183675 38.96 -76.80 45.70 MD GLENN DALE BELL STN USH00185111 39.08 -76.90 121.90 MD LAUREL 3 W USH00185718 39.28 -76.61 6.10 MD MD SCI CTR BALTIMORE USH00185985 39.27 -75.87 9.10 MD MILLINGTON 1 SE USH00186620 39.41 -79.40 737.60 MD OAKLAND 1 SE USH00186770 38.68 -76.66 48.80 MD OWINGS FERRY LANDING USH00187330 38.21 -75.68 6.10 MD PRINCESS ANNE USH00187806 38.71 -76.18 3.00 MD ROYAL OAK 2 SSW USH00188000 38.36 -75.58 3.00 MD SALISBURY USH00189440 39.55 -76.96 233.20 MD WESTMINSTER POL BRKS USH00189750 39.33 -76.86 140.20 MD WOODSTOCK USH00190120 42.38 -72.53 45.70 MA AMHERST USH00190535 42.48 -71.28 48.80 MA BEDFORD USH00190736 42.21 -71.11 192.00 MA BLUE HILL USH00193213 42.14 -73.41 249.00 MA GREAT BARRINGTON 5 SW USH00194105 42.69 -71.16 15.20 MA LAWRENCE USH00195246 41.63 -70.93 21.30 MA NEW BEDFORD USH00196486 41.98 -70.69 13.70 MA PLYMOUTH-KINGSTON USH00196681 42.05 -70.18 6.10 MA PROVINCETOWN USH00196783 42.52 -71.12 27.40 MA READING USH00198367 41.90 -71.06 6.10 MA TAUNTON USH00198757 42.16 -71.24 50.30 MA WALPOLE 2 USH00199316 42.13 -71.43 64.00 MA WEST MEDWAY USH00200032 41.91 -84.01 231.60 MI ADRIAN 2 NNE USH00200128 42.58 -85.78 228.60 MI ALLEGAN 5NE USH00200146 43.38 -84.64 224.00 MI ALMA USH00200230 42.29 -83.71 274.30 MI ANN ARBOR U OF USH00200779 43.70 -85.48 283.50 MI BIG RAPIDS WTR WKS USH00201439 46.51 -87.98 487.40 MI CHAMPION VAN RIPER PK USH00201486 46.34 -86.92 265.20 MI CHATHAM EXP FARM 2 USH00201492 45.65 -84.47 179.20 MI CHEBOYGAN USH00201675 41.96 -84.99 299.90 MI COLDWATER ST SCHOOL USH00202423 44.28 -83.50 178.60 MI EAST TAWAS USH00202737 45.66 -86.71 227.10 MI FAYETTE 4 SW USH00203632 43.67 -86.42 234.70 MI HART 3 WSW USH00203823 41.93 -84.64 329.20 MI HILLSDALE USH00204090 45.78 -88.08 326.40 MI IRON MT KINGSFORD WWTP USH00204104 46.46 -90.18 435.90 MI IRONWOOD USH00204244 42.28 -85.60 289.60 MI KALAMAZOO STATE HOSP USH00205434 43.60 -84.20 195.10 MI MIDLAND USH00205650 42.60 -82.81 176.80 MI MT CLEMENS ANG BASE USH00205662 43.58 -84.76 242.60 MI MT PLEASANT UNIV USH00205690 46.41 -86.66 207.30 MI MUNISING USH00205816 46.31 -85.51 259.10 MI NEWBERRY 3S USH00206300 43.01 -84.18 222.50 MI OWOSSO WWTP USH00207690 42.40 -86.28 189.00 MI SOUTH HAVEN USH00207812 46.05 -88.62 442.00 MI STAMBAUGH 2SSE USH00210018 47.29 -96.51 276.50 MN ADA USH00210075 43.60 -93.30 374.90 MN ALBERT LEA 3 SE USH00210252 48.33 -96.82 258.20 MN ARGYLE USH00210515 48.70 -94.58 323.70 MN BAUDETTE USH00211465 44.80 -93.58 219.50 MN CHASKA USH00211630 46.70 -92.52 385.60 MN CLOQUET USH00212142 46.83 -95.83 413.00 MN DETROIT LAKES 1 NNE USH00212645 47.45 -92.53 440.40 MN EVELETH WWTP USH00212698 43.64 -94.46 361.80 MN FAIRMONT USH00212737 44.66 -93.17 298.70 MN FARMINGTON 3 NW USH00212916 47.56 -95.72 399.30 MN FOSSTON 1 E USH00213290 43.70 -92.56 411.50 MN GRAND MEADOW USH00213303 47.24 -93.49 399.30 MN GRAND RPDS FOREST LAB USH00214106 47.22 -95.19 454.20 MN ITASCA UNIV OF MINN USH00214652 47.24 -94.22 396.80 MN LEECH LAKE USH00215175 47.63 -93.65 422.80 MN MARCELL 5NE USH00215400 45.12 -95.92 310.90 MN MILAN 1 NW USH00215435 44.88 -93.22 265.80 MN MINNEAPOLIS/ST PAUL AP USH00215563 44.93 -95.75 300.20 MN MONTEVIDEO 1 SW USH00215615 45.87 -93.31 310.30 MN MORA USH00215638 45.59 -95.87 347.50 MN MORRIS WC EXP STN USH00215887 44.30 -94.48 271.30 MN NEW ULM 2 SE USH00216152 44.76 -94.92 335.30 MN OLIVIA 3E USH00216360 46.90 -95.06 437.10 MN PARK RAPIDS 2 S USH00216547 46.66 -94.10 381.00 MN PINE RIVER DAM USH00216565 44.01 -96.32 519.70 MN PIPESTONE USH00217087 48.84 -95.76 319.10 MN ROSEAU USH00217405 44.32 -93.96 259.10 MN ST PETER USH00217460 46.79 -93.32 376.10 MN SANDY LAKE DAM LIBBY USH00218419 47.02 -91.66 190.50 MN TWO HARBORS USH00218618 47.07 -94.57 429.80 MN WALKER AH GWAH CHING USH00219046 43.76 -94.18 338.30 MN WINNEBAGO USH00219249 44.29 -92.66 300.20 MN ZUMBROTA USH00220021 33.83 -88.52 60.40 MS ABERDEEN USH00220488 34.30 -89.98 67.10 MS BATESVILLE 2 SW USH00220955 34.66 -88.57 149.40 MS BOONEVILLE USH00221094 31.54 -90.45 132.60 MS BROOKHAVEN CITY USH00221389 32.67 -90.03 76.20 MS CANTON 4N USH00221707 34.18 -90.55 52.70 MS CLARKSDALE USH00221865 31.25 -89.83 45.70 MS COLUMBIA USH00221880 33.46 -88.38 44.20 MS COLUMBUS USH00221962 34.87 -88.61 117.30 MS CORINTH 7 SW USH00222094 31.94 -90.37 148.40 MS CRYSTAL SPGS EXP STN USH00223107 32.36 -89.42 137.20 MS FOREST USH00223605 33.35 -91.06 38.10 MS GREENVILLE USH00223887 31.25 -89.33 117.30 MS HATTIESBURG 5SW USH00223975 34.81 -89.98 115.80 MS HERNANDO USH00224173 34.82 -89.43 147.20 MS HOLLY SPRINGS 4 N USH00224776 33.05 -89.57 125.00 MS KOSCIUSKO USH00224939 31.67 -89.12 68.60 MS LAUREL USH00225247 33.13 -89.07 177.10 MS LOUISVILLE USH00225987 31.55 -90.10 58.20 MS MONTICELLO USH00226009 33.45 -90.50 35.70 MS MOORHEAD USH00226177 31.58 -91.34 59.40 MS NATCHEZ USH00226718 30.39 -88.47 3.70 MS PASCAGOULA 3 NE USH00227111 34.13 -88.99 123.40 MS PONTOTOC EXP STN USH00227128 30.84 -89.54 95.40 MS POPLARVILLE EXP STN USH00227132 31.98 -90.97 36.60 MS PORT GIBSON 1 NE USH00228374 33.46 -88.78 56.40 MS STATE UNIV USH00229079 34.38 -89.53 124.40 MS UNIVERSITY USH00229400 34.15 -89.63 94.50 MS WATER VALLEY USH00229426 30.29 -89.38 2.40 MS WAVELAND USH00229439 31.67 -88.67 61.00 MS WAYNESBORO 2 W USH00229793 31.09 -91.23 121.90 MS WOODVILLE 4 ESE USH00229860 32.90 -90.38 32.60 MS YAZOO CITY 5 NNE USH00230204 38.18 -94.02 259.70 MO APPLETON CITY USH00230856 39.34 -91.17 270.40 MO BOWLING GREEN 1 E USH00231037 39.42 -93.13 201.80 MO BRUNSWICK USH00231364 36.16 -89.66 82.30 MO CARUTHERSVILLE USH00231711 38.39 -93.77 234.70 MO CLINTON USH00231822 40.23 -94.68 337.70 MO CONCEPTION USH00232289 36.62 -90.81 88.10 MO DONIPHAN USH00232809 37.79 -90.41 282.90 MO FARMINGTON USH00234271 38.58 -92.18 204.20 MO JEFFERSON CITY WTP USH00234705 37.49 -94.26 298.70 MO LAMAR USH00234825 37.68 -92.69 389.80 MO LEBANON 2W USH00234850 38.88 -94.33 304.80 MO LEES SUMMIT REED WR USH00234904 39.18 -93.85 251.50 MO LEXINGTON 3E USH00235027 37.39 -93.94 326.10 MO LOCKWOOD USH00235253 37.30 -89.96 118.90 MO MARBLE HILL USH00235541 39.17 -91.88 244.40 MO MEXICO USH00235671 39.41 -92.43 262.10 MO MOBERLY USH00235834 37.15 -92.26 442.00 MO MTN GROVE 2 N USH00235976 36.86 -94.36 308.20 MO NEOSHO USH00237263 37.95 -91.77 355.70 MO ROLLA UNI OF MISSOURI USH00237963 40.24 -93.71 266.70 MO SPICKARD 7 W USH00238051 39.97 -91.88 210.30 MO STEFFENVILLE USH00238223 38.96 -93.41 205.70 MO SWEET SPRINGS USH00238466 38.25 -93.39 192.60 MO TRUMAN DAM & RSVR USH00238523 40.47 -93.00 323.10 MO UNIONVILLE USH00238725 38.83 -91.13 252.10 MO WARRENTON 1 N USH00240199 46.13 -112.95 1609.30 MT ANACONDA USH00240364 47.49 -112.39 1240.50 MT AUGUSTA USH00240780 45.83 -109.95 1249.70 MT BIG TIMBER USH00241044 45.66 -111.04 1497.50 MT BOZEMAN MONTANA ST U USH00241552 47.21 -111.71 1024.10 MT CASCADE 5 S USH00241722 48.58 -109.22 737.60 MT CHINOOK USH00241737 47.82 -112.19 1172.00 MT CHOTEAU USH00242173 48.60 -112.37 1169.80 MT CUT BANK AP USH00242409 45.21 -112.64 1593.50 MT DILLON WMCE USH00242689 45.89 -104.54 1043.90 MT EKALAKA USH00242793 45.33 -111.71 1509.70 MT ENNIS USH00243013 46.85 -108.31 954.90 MT FLATWILLOW 4 ENE USH00243089 48.77 -107.45 792.20 MT FORKS 4 NNE USH00243110 48.49 -109.79 796.40 MT FT ASSINNIBOINE USH00243139 48.77 -114.89 914.40 MT FORTINE 1 N USH00243558 48.21 -106.62 696.50 MT GLASGOW INTL AP USH00243581 47.10 -104.71 632.80 MT GLENDIVE USH00243751 47.47 -111.38 1116.80 MT GREAT FALLS AP USH00243885 46.25 -114.16 1080.50 MT HAMILTON USH00244038 44.86 -111.33 1977.80 MT HEBGEN DAM USH00244055 46.60 -111.96 1166.80 MT HELENA AP ASOS USH00244345 45.92 -108.24 924.80 MT HUNTLEY EXP STN USH00244364 45.93 -107.13 944.90 MT HYSHAM 25 SSE USH00244522 47.31 -106.91 798.60 MT JORDAN USH00244558 48.30 -114.26 901.30 MT KALISPELL GLACIER AP USH00245015 48.40 -115.53 638.90 MT LIBBY 1 NE RS USH00245080 45.48 -110.56 1484.40 MT LIVINGSTON 12 S USH00245338 48.39 -107.72 680.00 MT MALTA 7 E USH00245572 48.48 -104.45 591.90 MT MEDICINE LAKE 3 SE USH00245668 46.76 -104.96 757.10 MT MILDRED 5 N USH00245690 46.42 -105.88 799.80 MT MILES CITY AP USH00245761 47.05 -109.95 1310.60 MT MOCCASIN EXP STN USH00246157 45.48 -111.63 1446.30 MT NORRIS MADISON PH USH00246472 46.31 -113.30 1606.30 MT PHILIPSBURG RS USH00246601 46.41 -104.51 847.30 MT PLEVNA USH00246918 45.17 -109.24 1718.20 MT RED LODGE USH00247286 47.31 -114.09 883.90 MT SAINT IGNATIUS USH00247318 47.30 -115.09 810.80 MT SAINT REGIS 1 NE USH00247382 47.45 -104.33 602.00 MT SAVAGE USH00248501 48.30 -112.25 1161.30 MT VALIER USH00248569 47.88 -105.36 696.20 MT VIDA 6 NE USH00248597 45.29 -111.94 1759.60 MT VIRGINIA CITY USH00248857 44.65 -111.10 2029.70 MT WEST YELLOWSTONE USH00248930 46.54 -110.90 1536.20 MT WHITE SULPHUR SPRNGS 2 USH00250070 41.68 -98.00 545.60 NE ALBION USH00250130 42.11 -102.89 1217.40 NE ALLIANCE 1WNW USH00250375 41.04 -96.37 326.10 NE ASHLAND NO 2 USH00250420 42.51 -99.03 637.00 NE ATKINSON 3SW USH00250435 40.37 -95.74 283.50 NE AUBURN 5 ESE USH00250622 40.29 -96.75 395.30 NE BEATRICE 1N USH00250640 40.13 -99.82 658.40 NE BEAVER CITY USH00251145 41.66 -103.10 1117.40 NE BRIDGEPORT USH00251200 41.40 -99.67 762.00 NE BROKEN BOW 2 W USH00252020 40.61 -96.94 437.40 NE CRETE USH00252100 40.67 -100.49 829.40 NE CURTIS 3NNE USH00252205 41.24 -97.13 490.70 NE DAVID CITY USH00252820 40.07 -97.16 411.50 NE FAIRBURY 5S USH00252840 40.64 -97.59 499.90 NE FAIRMONT USH00253035 40.10 -98.96 565.40 NE FRANKLIN USH00253175 40.53 -97.59 496.80 NE GENEVA USH00253185 41.45 -97.76 484.60 NE GENOA 2 W USH00253365 40.94 -100.15 787.90 NE GOTHENBURG USH00253615 42.68 -103.88 1478.30 NE HARRISON USH00253630 42.61 -97.26 417.60 NE HARTINGTON USH00253660 40.64 -98.38 591.30 NE HASTINGS 4N USH00253715 42.51 -102.69 1159.80 NE HAY SPRINGS 12 S USH00253735 40.17 -97.59 451.10 NE HEBRON USH00253910 40.45 -99.38 707.10 NE HOLDREGE USH00254110 40.52 -101.65 999.70 NE IMPERIAL USH00254440 41.24 -103.63 1435.00 NE KIMBALL 2NE USH00254900 41.14 -102.63 1168.00 NE LODGEPOLE USH00254985 41.28 -98.96 627.30 NE LOUP CITY USH00255080 41.82 -97.45 481.60 NE MADISON USH00255310 40.21 -100.62 796.10 NE MC COOK USH00255470 42.91 -101.70 986.00 NE MERRIMAN USH00255565 40.51 -98.95 658.40 NE MINDEN USH00256040 41.49 -98.77 597.40 NE NORTH LOUP USH00256135 42.06 -97.96 521.20 NE OAKDALE USH00256570 40.12 -96.15 378.00 NE PAWNEE CITY USH00256970 42.06 -100.24 819.90 NE PURDUM USH00257070 40.09 -98.51 524.30 NE RED CLOUD USH00257515 41.26 -98.46 541.00 NE SAINT PAUL 4N USH00257715 40.90 -97.09 438.90 NE SEWARD USH00258133 41.45 -100.59 911.40 NE STAPLETON 5W USH00258395 40.68 -96.18 335.30 NE SYRACUSE USH00258465 40.35 -96.19 338.30 NE TECUMSEH 1S USH00258480 41.78 -96.22 338.30 NE TEKAMAH USH00258915 42.26 -96.86 423.70 NE WAKEFIELD USH00259090 40.86 -96.14 335.30 NE WEEPING WATER USH00259510 40.86 -97.59 490.70 NE YORK USH00260507 39.49 -117.06 2066.50 NV AUSTIN #2 USH00260691 40.61 -116.89 1373.10 NV BATTLE MOUNTAIN 4SE USH00261071 35.98 -114.84 762.00 NV BOULDER CITY USH00262573 40.82 -115.78 1533.10 NV ELKO RGNL AP USH00262780 39.45 -118.78 1208.50 NV FALLON EXP STN USH00263245 40.95 -117.49 1339.30 NV GOLCONDA USH00264698 40.19 -118.47 1211.60 NV LOVELOCK USH00264950 39.41 -114.77 1911.10 NV MCGILL USH00265168 38.38 -118.10 1391.70 NV MINA USH00266779 39.48 -119.77 1344.20 NV RENO AP USH00267369 35.46 -114.92 1079.00 NV SEARCHLIGHT USH00268988 41.10 -114.97 1737.40 NV WELLS USH00269171 40.90 -117.80 1309.40 NV WINNEMUCCA AP USH00270706 44.30 -71.65 359.70 NH BETHLEHEM 2 USH00272174 43.15 -70.95 24.40 NH DURHAM USH00272999 45.08 -71.28 506.00 NH FIRST CONNECTICUT LAKE USH00273850 43.70 -72.28 183.80 NH HANOVER USH00274399 42.93 -72.32 158.50 NH KEENE USH00280325 39.37 -74.42 3.00 NJ ATLANTIC CITY USH00280734 40.82 -75.08 80.20 NJ BELVIDERE BRG USH00280907 40.90 -74.40 85.30 NJ BOONTON 1 SE USH00281582 41.03 -74.42 231.60 NJ CHARLOTTEBURG RSVR USH00283029 40.56 -74.88 79.20 NJ FLEMINGTON 5 NNW USH00283951 40.26 -74.56 30.50 NJ HIGHTSTOWN 2 W USH00284229 39.81 -74.78 30.50 NJ INDIAN MILLS 2 W USH00284987 40.27 -74.00 9.10 NJ LONG BRANCH OAKHURST USH00285728 39.95 -74.96 13.70 NJ MOORESTOWN USH00286055 40.47 -74.43 26.20 NJ NEW BRUNSWICK 3 SE USH00287079 40.60 -74.40 27.40 NJ PLAINFIELD USH00288816 39.95 -74.21 30.50 NJ TOMS RIVER USH00290692 36.83 -108.00 1720.30 NM AZTEC RUINS NM USH00290858 35.52 -104.09 1371.60 NM BELL RANCH USH00291469 32.34 -104.22 951.00 NM CARLSBAD USH00291515 33.63 -105.89 1647.40 NM CARRIZOZO 1SW USH00291664 36.91 -106.57 2392.70 NM CHAMA USH00291813 36.46 -104.94 1993.40 NM CIMARRON 4 SW USH00291887 36.44 -103.15 1511.80 NM CLAYTON MUNI ARPK AP USH00292608 36.93 -107.00 2070.50 NM DULCE USH00292848 33.14 -107.18 1394.80 NM ELEPHANT BUTTE DAM USH00293265 32.79 -108.15 1872.10 NM FT BAYARD USH00293294 34.46 -104.23 1226.80 NM FT SUMNER USH00293368 32.22 -108.08 1365.20 NM GAGE USH00294369 35.77 -106.68 1908.70 NM JEMEZ SPRINGS USH00294426 32.61 -106.74 1300.30 NM JORNADA EXP RANGE USH00294862 35.56 -105.21 1935.20 NM LAS VEGAS WWTP USH00295150 34.76 -106.76 1475.20 NM LOS LUNAS 3 SSW USH00295273 33.82 -108.94 2148.80 NM LUNA RS USH00295960 32.95 -105.82 2066.50 NM MTN PARK USH00295965 34.52 -106.26 1987.30 NM MOUNTAINAIR USH00296435 32.37 -106.09 1274.70 NM OROGRANDE USH00297323 36.70 -105.40 2644.40 NM RED RIVER USH00297610 33.30 -104.50 1112.20 NM ROSWELL IND AP USH00297867 35.10 -103.32 1289.30 NM SAN JON USH00298107 34.93 -104.68 1405.10 NM SANTA ROSA USH00298387 34.08 -106.88 1397.50 NM SOCORRO USH00298501 36.36 -104.58 1794.70 NM SPRINGER USH00298535 32.28 -106.75 1182.90 NM STATE UNIV USH00299156 35.20 -103.68 1245.40 NM TUCUMCARI 4 NE USH00299165 33.07 -106.04 1350.30 NM TULAROSA USH00300023 42.10 -77.23 304.50 NY ADDISON USH00300042 42.74 -73.80 83.80 NY ALBANY INTL AP USH00300085 42.26 -77.78 539.50 NY ALFRED USH00300093 42.10 -78.75 457.20 NY ALLEGANY SP USH00300183 42.30 -77.98 440.40 NY ANGELICA USH00300321 42.93 -76.54 234.70 NY AUBURN USH00300443 43.03 -78.16 278.30 NY BATAVIA USH00300687 42.20 -75.98 486.20 NY BINGHAMTON GREATER AP USH00300889 40.94 -72.30 18.30 NY BRIDGEHAMPTON USH00300937 43.20 -77.93 163.10 NY BROCKPORT USH00301012 42.94 -78.73 214.90 NY BUFFALO NIAGARA INTL USH00301185 44.57 -75.10 136.60 NY CANTON 4 SE USH00301401 44.87 -73.39 47.90 NY CHAZY USH00301752 42.71 -74.92 383.10 NY COOPERSTOWN USH00301799 42.60 -76.18 344.10 NY CORTLAND USH00301966 44.71 -73.72 408.40 NY DANNEMORA USH00301974 42.56 -77.71 201.20 NY DANSVILLE USH00302060 42.06 -75.42 304.80 NY DEPOSIT USH00302129 41.00 -73.83 61.00 NY DOBBS FERRY ARDSLEY USH00302610 42.09 -76.83 288.60 NY ELMIRA USH00303033 42.44 -79.31 231.60 NY FREDONIA USH00303184 42.87 -77.03 218.80 NY GENEVA RSCH FARM USH00303259 41.51 -73.93 83.80 NY GLENHAM USH00303319 43.04 -74.35 246.90 NY GLOVERSVILLE USH00303773 42.77 -77.60 274.90 NY HEMLOCK USH00304102 43.75 -74.26 506.00 NY INDIAN LAKE 2SW USH00304174 42.44 -76.44 292.60 NY ITHACA CORNELL UNIV USH00304555 44.24 -73.98 591.30 NY LAKE PLACID 2 S USH00304647 44.75 -74.66 142.00 NY LAWRENCEVILLE 3 SW USH00304791 43.06 -74.86 274.30 NY LITTLE FALLS CITY RSVR USH00304796 43.03 -74.86 109.70 NY LITTLE FALLS MILL ST USH00304844 43.13 -78.68 184.40 NY LOCKPORT 3 S USH00304912 43.79 -75.48 262.10 NY LOWVILLE USH00304996 44.84 -74.30 268.20 NY MALONE USH00305113 42.46 -75.01 373.40 NY MARYLAND 9 SW USH00305426 41.76 -74.15 379.50 NY MOHONK LAKE USH00305512 42.84 -75.72 396.20 NY MORRISVILLE 6 SW USH00305801 40.77 -73.96 39.60 NY NY CITY CNTRL PARK USH00306085 42.51 -75.51 301.40 NY NORWICH USH00306164 44.72 -75.44 85.30 NY OGDENSBURG 4 NE USH00306314 43.46 -76.49 106.70 NY OSWEGO EAST USH00306774 41.38 -74.68 143.30 NY PORT JERVIS USH00306820 41.59 -73.91 51.80 NY POUGHKEEPSIE USH00307167 43.11 -77.67 162.50 NY ROCHESTER INTL AP USH00307484 43.03 -73.81 94.50 NY SARATOGA SPRINGS 4 SW USH00307633 40.95 -73.10 12.20 NY SETAUKET STRONG USH00308248 42.69 -73.83 515.10 NY STILLWATER RSVR USH00308383 43.10 -76.10 125.00 NY SYRACUSE WSO AP USH00308600 42.75 -73.68 7.30 NY TROY L&D USH00308631 44.23 -74.43 512.10 NY TUPPER LAKE SUNMOUNT USH00308737 43.14 -75.38 216.70 NY UTICA FAA AP USH00308906 41.55 -74.16 115.80 NY WALDEN 1 ESE USH00308910 42.74 -78.51 332.20 NY WALES USH00308944 44.14 -74.90 460.20 NY WANAKENA RNGR SCHOOL USH00309000 43.97 -75.87 151.50 NY WATERTOWN USH00309292 41.39 -73.96 97.50 NY WEST POINT USH00309670 41.26 -73.79 204.20 NY YORKTOWN HEIGHTS 1 W USH00310090 35.39 -80.19 185.90 NC ALBEMARLE USH00311458 35.23 -75.62 3.40 NC CAPE HATTERAS AP USH00311677 35.90 -79.07 152.40 NC CHAPEL HILL 2 W USH00312635 36.01 -76.55 3.00 NC EDENTON USH00312719 36.30 -76.20 2.40 NC ELIZABETH CITY USH00313017 35.05 -78.85 29.30 NC FAYETTEVILLE PWC USH00313510 35.34 -77.96 33.20 NC GOLDSBORO 4 SE USH00313969 36.34 -78.41 146.30 NC HENDERSON 2 NNW USH00313976 35.32 -82.44 658.40 NC HENDERSONVILLE 1 NE USH00314055 35.05 -83.18 1170.40 NC HIGHLANDS USH00314684 35.19 -77.54 7.30 NC KINSTON 7 SE USH00314938 35.91 -81.53 365.80 NC LENOIR USH00315123 36.10 -78.30 79.20 NC LOUISBURG USH00315177 34.62 -79.02 34.10 NC LUMBERTON USH00315340 35.66 -82.02 446.80 NC MARION 2 NW USH00315356 35.80 -82.66 609.60 NC MARSHALL USH00315771 34.97 -80.52 167.60 NC MONROE 2 SE USH00315830 34.73 -76.73 3.00 NC MOREHEAD CITY 2 WNW USH00315838 35.73 -81.67 353.60 NC MORGANTON USH00315890 36.49 -80.65 317.30 NC MT AIRY 2 W USH00317202 36.38 -79.69 271.30 NC REIDSVILLE 2 NW USH00317615 35.68 -80.48 213.40 NC SALISBURY USH00317994 35.51 -78.34 45.70 NC SMITHFIELD USH00318113 33.99 -78.00 6.10 NC SOUTHPORT 5 N USH00318292 35.81 -80.88 289.60 NC STATESVILLE 2 NNE USH00318500 35.88 -77.53 10.70 NC TARBORO 1 S USH00318694 36.39 -81.30 876.30 NC TRANSOU USH00319147 35.48 -82.96 810.20 NC WAYNESVILLE 1 E USH00319476 35.69 -77.94 33.50 NC WILSON 3 SW USH00320941 48.82 -100.44 496.20 ND BOTTINEAU USH00321408 46.87 -97.23 285.00 ND CASSELTON AGRONOMY FM USH00321871 48.90 -103.29 595.00 ND CROSBY USH00322188 46.89 -102.81 749.80 ND DICKINSON EXP STN USH00322365 47.34 -102.58 671.80 ND DUNN CENTER 1E USH00323207 46.05 -100.66 510.50 ND FT YATES 4 SW USH00323287 46.15 -98.40 437.40 ND FULLERTON 1 ESE USH00323594 48.41 -97.42 252.10 ND GRAFTON USH00323621 47.92 -97.09 253.00 ND GRAND FORKS UNIV NWS USH00324178 45.99 -102.64 816.90 ND HETTINGER USH00324203 47.43 -97.06 277.40 ND HILLSBORO 3 N USH00324418 46.88 -98.68 447.10 ND JAMESTOWN STATE HOSP USH00324958 48.76 -98.34 492.30 ND LANGDON EXP FARM USH00325220 46.45 -97.68 336.50 ND LISBON USH00325479 46.81 -100.90 533.40 ND MANDAN EXP STN USH00326015 46.67 -100.22 548.60 ND MOFFIT 3 SE USH00326155 46.37 -102.31 772.70 ND MOTT USH00326255 46.50 -99.76 603.50 ND NAPOLEON USH00326315 46.54 -102.86 804.40 ND NEW ENGLAND USH00326947 48.97 -97.24 240.80 ND PEMBINA USH00327530 46.88 -102.31 752.90 ND RICHARDTON ABBEY USH00328792 48.37 -100.39 451.10 ND TOWNER 2 NE USH00329100 46.32 -96.61 291.40 ND WAHPETON 3 N USH00329445 48.60 -100.29 449.00 ND WILLOW CITY USH00331072 40.81 -82.96 291.10 OH BUCYRUS USH00331152 40.26 -80.99 384.00 OH CADIZ USH00331541 41.05 -81.93 359.70 OH CHIPPEWA LAKE USH00331592 39.61 -82.95 205.10 OH CIRCLEVILLE USH00331890 40.24 -81.87 231.60 OH COSHOCTON WPC PLT USH00332098 41.27 -84.38 213.40 OH DEFIANCE USH00332119 40.31 -83.07 280.40 OH DELAWARE USH00332791 41.04 -83.66 234.10 OH FINDLAY WPCC USH00333375 40.10 -84.65 312.10 OH GREENVILLE WTP USH00333758 39.20 -83.61 335.30 OH HILLSBORO USH00333780 41.30 -81.15 374.90 OH HIRAM USH00334189 40.64 -83.60 303.30 OH KENTON USH00335041 39.65 -81.85 231.60 OH MC CONNELLSVILLE LK 7 USH00335297 40.55 -81.91 249.60 OH MILLERSBURG USH00335315 40.76 -80.85 356.60 OH MILLPORT 4 NE USH00336118 41.26 -82.61 204.20 OH NORWALK WWTP USH00336196 41.26 -82.21 248.70 OH OBERLIN USH00336600 39.83 -81.91 310.90 OH PHILO 3 SW USH00336781 38.75 -82.88 164.60 OH PORTSMOUTH-SCIOTOVILLE USH00338313 41.11 -83.16 225.60 OH TIFFIN USH00338534 40.83 -83.28 260.30 OH UPPER SANDUSKY USH00338552 40.10 -83.78 304.80 OH URBANA WWTP USH00338769 41.20 -80.81 274.30 OH WARREN 3 S USH00338822 41.51 -84.14 228.60 OH WAUSEON WTP USH00338830 39.11 -82.97 170.70 OH WAVERLY USH00339312 40.78 -81.91 310.90 OH WOOSTER EXP STN USH00340017 34.78 -96.68 309.40 OK ADA USH00340179 34.59 -99.33 420.60 OK ALTUS IRIG RSCH STN USH00340256 34.22 -95.61 143.30 OK ANTLERS USH00340292 34.17 -97.12 268.20 OK ARDMORE USH00340548 36.76 -96.02 217.90 OK BARTLESVILLE MUNI AP USH00340593 36.81 -100.53 751.30 OK BEAVER USH00340908 36.72 -102.48 1259.70 OK BOISE CITY 2 E USH00341243 36.80 -99.64 588.30 OK BUFFALO 2 SSW USH00341504 35.17 -98.57 451.40 OK CARNEGIE 5 NE USH00341724 36.77 -98.35 359.70 OK CHEROKEE USH00341828 36.32 -95.58 179.20 OK CLAREMORE 2 ENE USH00342678 34.00 -96.36 182.90 OK DURANT USH00342912 36.41 -97.87 379.50 OK ENID USH00342944 35.21 -99.86 627.90 OK ERICK USH00343497 35.62 -98.32 487.70 OK GEARY USH00343628 36.59 -101.61 1008.90 OK GOODWELL RSCH STN USH00343821 35.81 -97.39 338.30 OK GUTHRIE 5S USH00343871 35.58 -99.39 554.70 OK HAMMON 3 SSW USH00344055 36.09 -97.83 357.80 OK HENNESSEY 4 ESE USH00344204 34.98 -99.05 474.30 OK HOBART MUNI AP USH00344235 35.05 -96.38 260.60 OK HOLDENVILLE 2SSE USH00344298 36.85 -101.21 912.90 OK HOOKER USH00344573 36.72 -97.79 318.50 OK JEFFERSON USH00344766 36.90 -102.96 1325.90 OK KENTON USH00344861 35.85 -97.92 320.00 OK KINGFISHER USH00345063 34.60 -98.45 350.50 OK LAWTON USH00345509 34.89 -99.50 486.20 OK MANGUM USH00345779 35.50 -96.97 281.90 OK MEEKER 5 W USH00345855 36.88 -94.88 245.40 OK MIAMI USH00346130 35.77 -95.33 157.90 OK MUSKOGEE USH00346139 36.22 -99.17 576.10 OK MUTUAL USH00346278 36.89 -97.05 347.50 OK NEWKIRK 1NW USH00346629 36.12 -98.31 370.30 OK OKEENE USH00346638 35.42 -96.30 285.00 OK OKEMAH USH00346670 35.62 -96.02 197.20 OK OKMULGEE WTR WKS USH00346926 34.72 -97.28 286.50 OK PAULS VALLEY 4 WSW USH00346935 36.66 -96.34 254.50 OK PAWHUSKA USH00347012 36.28 -97.28 312.40 OK PERRY USH00347254 35.05 -94.62 134.10 OK POTEAU WTR WKS USH00348501 36.11 -97.09 272.80 OK STILLWATER 2 W USH00348677 35.93 -94.96 259.10 OK TAHLEQUAH USH00349395 34.17 -97.99 278.00 OK WAURIKA USH00349422 35.52 -98.69 493.20 OK WEATHERFORD USH00349445 35.48 -95.20 167.60 OK WEBBERS FALLS 5 WSW USH00350304 42.21 -122.71 532.20 OR ASHLAND USH00350328 46.15 -123.88 2.70 OR ASTORIA AP PORT OF USH00350412 44.84 -117.80 1024.40 OR BAKER CITY AP USH00350694 44.05 -121.28 1115.60 OR BEND USH00351055 42.03 -124.24 15.20 OR BROOKINGS 2 SE USH00351433 44.39 -122.48 292.60 OR CASCADIA USH00351765 45.23 -120.18 865.60 OR CONDON USH00351862 44.63 -123.19 68.60 OR CORVALLIS STATE UNIV USH00351897 43.79 -123.02 181.40 OR COTTAGE GROVE 1 NNE USH00351946 42.89 -122.13 1973.60 OR CRATER LAKE NPS HQ USH00352135 42.94 -117.33 1287.80 OR DANNER USH00352406 43.66 -123.32 89.00 OR DRAIN USH00352440 45.45 -121.13 405.40 OR DUFUR USH00352997 45.52 -123.10 54.90 OR FOREST GROVE USH00353095 43.39 -121.21 1404.80 OR FREMONT 5 NW USH00353445 42.42 -123.32 283.50 OR GRANTS PASS USH00353770 45.44 -122.15 228.00 OR HEADWORKS PORTLAND WTR USH00353827 45.36 -119.56 574.50 OR HEPPNER USH00353847 45.82 -119.26 195.10 OR HERMISTON 1 SE USH00354003 45.68 -121.51 152.40 OR HOOD RIVER EXP STN USH00354506 42.20 -121.78 1249.10 OR KLAMATH FALLS 2 SSW USH00354670 42.21 -120.36 1456.30 OR LAKEVIEW 2 NNW USH00355162 43.26 -118.84 1255.20 OR MALHEUR REFUGE HQ USH00355362 44.17 -122.11 450.50 OR MCKENZIE BRG RS USH00355384 45.22 -123.16 47.20 OR MC MINNVILLE USH00355593 45.94 -118.40 295.70 OR MILTON FREEWATER USH00355734 45.48 -120.72 570.00 OR MORO USH00356032 44.64 -124.05 37.20 OR NEWPORT USH00356073 43.41 -124.24 1.80 OR NORTH BEND FCWOS USH00356426 42.69 -120.54 1328.90 OR PAISLEY USH00356634 45.47 -118.82 524.30 OR PILOT ROCK 1 SE USH00356883 44.30 -120.80 888.50 OR PRINEVILLE USH00356907 42.73 -122.51 756.50 OR PROSPECT 2 SW USH00357169 42.95 -123.35 207.30 OR RIDDLE USH00357331 43.21 -123.36 129.50 OR ROSEBURG KQEN USH00358466 45.12 -122.07 341.40 OR THREE LYNX USH00358494 45.45 -123.87 3.00 OR TILLAMOOK 1 W USH00358746 45.20 -117.87 842.80 OR UNION EXP STN USH00358797 43.98 -117.24 682.80 OR VALE USH00358997 45.57 -117.53 890.90 OR WALLOWA USH00360106 40.65 -75.44 118.90 PA ALLENTOWN AP USH00361354 39.93 -77.63 195.10 PA CHAMBERSBURG 1 ESE USH00362537 39.80 -77.22 164.60 PA EISENHOWER NHS USH00362682 42.08 -80.18 222.50 PA ERIE WSO AP USH00363028 41.40 -79.83 309.40 PA FRANKLIN USH00363526 41.41 -80.36 344.40 PA GREENVILLE 2 NE USH00364385 40.33 -78.91 370.00 PA JOHNSTOWN USH00364896 40.33 -76.46 137.20 PA LEBANON 2 W USH00365915 41.85 -75.85 432.80 PA MONTROSE USH00366233 41.01 -80.36 251.50 PA NEW CASTLE 1 N USH00366689 40.80 -75.61 125.00 PA PALMERTON USH00367029 41.73 -75.44 548.60 PA PLEASANT MT 1 W USH00367322 40.42 -75.93 109.70 PA READING 4 NNW USH00367477 41.42 -78.74 414.50 PA RIDGWAY USH00367931 40.78 -76.86 128.00 PA SELINSGROVE 2 S USH00368449 40.79 -77.86 356.60 PA STATE COLLEGE USH00368596 41.01 -75.19 140.20 PA STROUDSBURG USH00368905 41.75 -76.44 231.60 PA TOWANDA 1 S USH00369050 39.91 -79.71 291.40 PA UNIONTOWN 1 NE USH00369298 41.85 -79.15 368.80 PA WARREN USH00369408 41.70 -77.38 554.10 PA WELLSBORO 4 SW USH00369464 39.97 -75.63 114.30 PA WEST CHESTER 2 NW USH00369728 41.24 -76.92 158.50 PA WILLIAMSPORT RGNL AP USH00369933 39.91 -76.75 118.90 PA YORK 3 SSW PUMP USH00370896 41.16 -71.58 33.50 RI BLOCK ISLAND STATE AP USH00374266 41.49 -71.54 34.70 RI KINGSTON USH00376698 41.72 -71.43 15.50 RI PROVIDENCE WSO AP USH00380074 33.49 -81.69 150.00 SC AIKEN 5SE USH00380165 34.52 -82.66 243.80 SC ANDERSON USH00380559 32.39 -80.69 7.60 SC BEAUFORT WWTP USH00380764 33.36 -81.32 98.80 SC BLACKVILLE 3 W USH00381277 34.09 -82.58 161.50 SC CALHOUN FALLS USH00381310 34.24 -80.65 42.70 SC CAMDEN 3 W USH00381549 32.78 -79.93 3.00 SC CHARLESTON CITY USH00381588 34.73 -79.88 42.70 SC CHERAW USH00381770 34.66 -82.82 251.20 SC CLEMSON UNIV USH00381944 33.98 -81.01 73.80 SC COLUMBIA UNIV OF SC USH00381997 33.83 -79.05 6.10 SC CONWAY USH00382260 34.30 -79.87 45.70 SC DARLINGTON USH00383468 33.36 -79.22 3.00 SC GEORGETOWN 2 E USH00383747 34.88 -82.22 287.40 SC GRNVL SPART INTL AP USH00383754 34.19 -82.17 187.50 SC GREENWOOD USH00384690 34.53 -80.59 138.10 SC KERSHAW 1SW USH00384753 33.67 -79.82 22.90 SC KINGSTREE USH00385017 34.49 -82.02 179.50 SC LAURENS USH00385200 34.19 -81.41 216.70 SC LITTLE MTN USH00386209 34.29 -81.62 145.10 SC NEWBERRY USH00386527 33.48 -80.87 54.90 SC ORANGEBURG 2 USH00387631 33.99 -81.77 146.30 SC SALUDA USH00387722 34.63 -81.52 158.50 SC SANTUCK USH00388426 33.03 -80.23 19.80 SC SUMMERVILLE 4W USH00388440 33.93 -80.35 53.90 SC SUMTER USH00388887 34.74 -83.08 298.70 SC WALHALLA USH00389327 34.37 -81.09 170.70 SC WINNSBORO USH00389350 34.93 -81.03 210.30 SC WINTHROP UNIV USH00389469 32.68 -80.84 7.60 SC YEMASSEE USH00390020 45.44 -98.41 395.30 SD ABERDEEN RGNL AP USH00390043 43.48 -99.06 512.10 SD ACADEMY 2NE USH00390128 43.65 -97.78 412.40 SD ALEXANDRIA USH00391392 43.30 -96.59 410.00 SD CANTON USH00391739 44.88 -97.73 549.90 SD CLARK USH00391972 43.96 -101.86 735.80 SD COTTONWOOD 2 E USH00392429 45.04 -101.59 723.90 SD DUPREE USH00392797 45.76 -99.63 566.90 SD EUREKA USH00392927 45.03 -99.13 478.50 SD FAULKTON 1 NW USH00393029 44.04 -98.07 374.90 SD FORESTBURG 3 NE USH00393217 44.05 -99.07 524.30 SD GANN VALLEY 4NW USH00393832 44.52 -99.45 576.10 SD HIGHMORE 1 W USH00394007 43.43 -103.47 1085.10 SD HOT SPRINGS USH00394037 44.01 -97.52 474.90 SD HOWARD USH00394516 43.90 -99.86 518.20 SD KENNEBEC USH00395456 45.15 -98.58 396.80 SD MELLETTE 4 W USH00395481 43.23 -97.57 403.60 SD MENNO USH00395536 45.28 -96.66 349.00 SD MILBANK 4 NW USH00395891 43.88 -100.70 707.10 SD MURDO USH00396170 44.44 -100.41 506.00 SD OAHE DAM USH00396597 44.38 -100.28 531.00 SD PIERRE RGNL AP USH00396947 44.11 -103.28 1051.60 SD RAPID CITY 4NW USH00398622 42.76 -96.91 362.70 SD VERMILLION 2 SE USH00398932 44.90 -97.14 532.80 SD WATERTOWN RGNL AP USH00399442 43.49 -100.47 664.50 SD WOOD USH00401790 36.54 -87.35 116.40 TN CLARKSVILLE WWTP USH00402024 34.99 -84.37 442.00 TN COPPERHILL USH00402108 35.54 -89.70 117.30 TN COVINGTON 3 SW USH00402202 36.01 -85.13 551.70 TN CROSSVILLE ED & RESEARCH USH00402489 36.07 -87.39 237.70 TN DICKSON USH00402589 36.48 -87.86 144.80 TN DOVER 1 W USH00404561 35.62 -88.84 121.90 TN JACKSON EXP STN USH00405187 35.41 -86.80 239.90 TN LEWISBURG EXP STN USH00405882 35.67 -85.78 286.50 TN MC MINNVILLE USH00406371 35.92 -86.37 163.10 TN MURFREESBORO 5 N USH00406534 35.98 -83.20 315.80 TN NEWPORT 1 NW USH00407884 36.41 -82.98 413.00 TN ROGERSVILLE 1 NE USH00409155 35.34 -86.20 311.50 TN TULLAHOMA USH00409219 36.39 -89.03 106.70 TN UNION CITY USH00409502 35.30 -87.75 228.60 TN WAYNESBORO USH00410120 32.72 -99.30 426.70 TX ALBANY USH00410144 27.72 -98.06 61.30 TX ALICE USH00410174 30.37 -103.66 1356.40 TX ALPINE USH00410493 31.74 -99.97 534.90 TX BALLINGER 2 NW USH00410498 30.98 -103.74 981.50 TX BALMORHEA USH00410639 28.45 -97.70 77.70 TX BEEVILLE 5 NE USH00410832 30.10 -98.42 419.10 TX BLANCO USH00410902 29.79 -98.73 440.10 TX BOERNE USH00411000 35.53 -102.25 972.60 TX BOYS RANCH USH00411048 30.15 -96.39 95.40 TX BRENHAM USH00411138 31.73 -98.94 426.70 TX BROWNWOOD 2ENE USH00411528 28.33 -99.63 170.70 TX CATARINA USH00411772 33.61 -95.07 132.60 TX CLARKSVILLE 2NE USH00412015 27.77 -97.51 13.40 TX CORPUS CHRISTI AP USH00412019 32.10 -96.47 125.90 TX CORSICANA USH00412121 33.65 -101.24 917.40 TX CROSBYTON USH00412266 29.05 -96.23 21.30 TX DANEVANG 1 W USH00412598 32.06 -98.30 447.40 TX DUBLIN 2SE USH00412679 28.75 -100.47 247.50 TX EAGLE PASS 3N USH00412797 31.81 -106.37 1194.20 TX EL PASO AP USH00412906 28.02 -99.35 176.80 TX ENCINAL USH00413063 27.13 -98.12 42.40 TX FALFURRIAS USH00413183 29.67 -97.11 158.50 TX FLATONIA USH00413280 30.90 -102.91 926.00 TX FT STOCKTON USH00413420 33.64 -97.05 265.20 TX GAINESVILLE 5 ENE USH00413734 33.16 -96.09 166.10 TX GREENVILLE KGVL RADIO USH00413873 29.47 -96.93 83.80 TX HALLETTSVILLE 2 N USH00413992 33.15 -99.74 487.70 TX HASKELL USH00415018 31.07 -98.18 314.60 TX LAMPASAS USH00415196 30.05 -94.79 10.70 TX LIBERTY USH00415272 30.74 -98.65 310.90 TX LLANO USH00415429 29.67 -97.65 121.90 TX LULING USH00415618 32.54 -94.35 107.30 TX MARSHALL USH00415707 31.13 -102.22 757.70 TX MCCAMEY USH00415869 31.70 -96.51 161.50 TX MEXIA USH00415875 35.70 -100.64 839.70 TX MIAMI USH00416135 34.21 -102.73 1167.40 TX MULESHOE #1 USH00416276 29.71 -98.11 208.80 TX NEW BRAUNFELS USH00416794 33.67 -95.55 165.20 TX PARIS USH00416892 31.41 -103.50 795.50 TX PECOS USH00417079 34.18 -101.70 1027.20 TX PLAINVIEW USH00417336 34.27 -99.75 488.30 TX QUANAH 2 SW USH00417622 26.37 -98.81 52.40 TX RIO GRANDE CITY USH00417945 29.53 -98.47 246.60 TX SAN ANTONIO INTL AP USH00418201 32.71 -102.65 1016.80 TX SEMINOLE USH00418433 32.71 -100.91 706.80 TX SNYDER USH00418692 36.33 -102.07 1125.60 TX STRATFORD USH00418910 31.07 -97.31 193.50 TX TEMPLE USH00419532 32.74 -97.77 291.10 TX WEATHERFORD USH00420086 37.44 -112.48 2145.80 UT ALTON USH00420738 37.61 -109.48 1854.70 UT BLANDING USH00420788 37.28 -109.55 1318.00 UT BLUFF USH00421731 41.54 -112.11 1289.30 UT CORINNE USH00422101 39.28 -112.65 1399.00 UT DESERET USH00422253 40.16 -110.39 1682.50 UT DUCHESNE USH00422592 37.76 -111.59 1770.90 UT ESCALANTE USH00422726 41.02 -111.93 1335.00 UT FARMINGTON 3 NW USH00422828 38.96 -112.32 1560.60 UT FILLMORE USH00422996 40.28 -109.86 1539.20 UT FT DUCHESNE USH00423418 38.99 -110.15 1240.50 UT GREEN RIVER AVIATION USH00423611 38.37 -110.71 1313.10 UT HANKSVILLE USH00423809 40.49 -111.42 1703.80 UT HEBER USH00424508 37.02 -112.53 1493.50 UT KANAB USH00424856 41.82 -111.32 1822.70 UT LAKETOWN USH00425065 39.56 -111.86 1614.80 UT LEVAN USH00425186 41.74 -111.80 1460.00 UT LOGAN UTAH ST UNIV USH00425402 39.25 -111.63 1749.60 UT MANTI USH00425477 38.45 -112.22 1801.40 UT MARYSVALE USH00425733 38.57 -109.54 1242.70 UT MOAB USH00425752 37.79 -113.92 1664.20 UT MODENA USH00425826 41.04 -111.67 1551.40 UT MORGAN POWER & LIGHT USH00426135 39.71 -111.83 1563.00 UT NEPHI USH00426404 41.24 -111.94 1325.90 UT OGDEN PIONEER P H USH00426601 37.82 -112.44 2020.80 UT PANGUITCH USH00426686 37.84 -112.82 1828.80 UT PAROWAN PWR USH00427260 38.76 -112.07 1615.40 UT RICHFIELD RADIO KSVC USH00427516 37.10 -113.56 844.30 UT ST GEORGE USH00427559 38.91 -111.41 2304.30 UT SALINA 24 E USH00427714 39.24 -112.10 1619.70 UT SCIPIO USH00427729 39.68 -111.20 2655.40 UT SCOFIELD-SKYLINE MINE USH00427909 40.54 -111.50 1831.80 UT SNAKE CREEK POWERHOUSE USH00428119 40.07 -111.60 1438.70 UT SPANISH FORK PWR HOUSE USH00428705 38.96 -109.71 1554.20 UT THOMPSON USH00428771 40.52 -112.29 1546.60 UT TOOELE USH00428973 40.35 -111.89 1370.70 UT UTAH LAKE LEHI USH00429111 40.42 -109.55 1668.50 UT VERNAL 2SW USH00429382 40.72 -114.03 1291.40 UT WENDOVER AP AWOS USH00429595 41.52 -111.14 1924.80 UT WOODRUFF USH00429717 37.20 -112.98 1234.40 UT ZION NP USH00431081 44.46 -73.15 100.60 VT BURLINGTON WSO AP USH00431243 43.38 -72.59 256.60 VT CAVENDISH USH00431360 43.98 -72.45 243.80 VT CHELSEA USH00431580 43.95 -73.21 105.20 VT CORNWALL USH00432769 44.90 -72.80 128.00 VT ENOSBURG FALLS USH00437054 44.42 -72.01 213.40 VT SAINT JOHNSBURY USH00437607 44.62 -73.30 33.50 VT SOUTH HERO USH00437612 44.07 -72.97 408.70 VT SOUTH LINCOLN USH00440766 37.20 -80.41 640.10 VA BLACKSBURG NWSO USH00440993 37.70 -78.28 68.60 VA BREMO BLUFF USH00441209 37.09 -81.33 935.10 VA BURKES GARDEN USH00441593 38.03 -78.52 265.20 VA CHARLOTTESVILLE 2W USH00442208 38.45 -78.93 426.70 VA DALE ENTERPRISE USH00442245 36.58 -79.38 125.00 VA DANVILLE USH00442941 37.32 -78.38 137.20 VA FARMVILLE 2 N USH00443192 38.31 -77.45 27.40 VA FREDERICKSBURG NP USH00444101 37.29 -77.27 12.20 VA HOPEWELL USH00444128 37.99 -79.83 681.50 VA HOT SPRINGS USH00444876 37.79 -79.41 342.90 VA LEXINGTON USH00444909 39.08 -77.69 152.40 VA LINCOLN USH00446139 36.90 -76.19 9.10 VA NORFOLK INTL AP USH00446626 36.73 -82.99 448.10 VA PENNINGTON GAP USH00446712 38.23 -78.12 158.50 VA PIEDMONT RSCH STN USH00447338 36.97 -79.89 400.80 VA ROCKY MT USH00448062 38.18 -79.09 499.90 VA STAUNTON WATER TRMTMT PLT USH00449151 37.30 -76.70 21.30 VA WILLIAMSBURG 2 N USH00449263 38.90 -78.48 205.70 VA WOODSTOCK 2 NE USH00450008 46.96 -123.82 3.00 WA ABERDEEN USH00450587 48.71 -122.51 4.60 WA BELLINGHAM 3 SSW USH00450729 48.97 -122.79 18.30 WA BLAINE USH00450945 47.16 -122.00 208.80 WA BUCKLEY 1 NE USH00451233 47.41 -121.75 475.50 WA CEDAR LAKE USH00451276 46.72 -122.95 56.40 WA CENTRALIA USH00451484 48.96 -122.32 19.50 WA CLEARBROOK USH00451504 47.18 -120.94 585.20 WA CLE ELUM USH00451630 48.54 -117.90 474.60 WA COLVILLE USH00451666 48.54 -119.74 707.10 WA CONCONULLY USH00451939 47.37 -123.16 6.40 WA CUSHMAN POWERHOUSE 2 USH00452007 47.65 -118.14 743.70 WA DAVENPORT USH00452030 46.31 -118.00 474.60 WA DAYTON 1 WSW USH00452505 46.96 -120.54 451.10 WA ELLENSBURG USH00452675 47.97 -122.19 18.30 WA EVERETT USH00452914 47.95 -124.35 106.70 WA FORKS 1 E USH00453222 45.80 -120.84 499.90 WA GOLDENDALE USH00454154 46.21 -119.10 118.90 WA KENNEWICK USH00454748 46.36 -124.03 7.60 WA LONG BEACH EXP STN USH00454764 46.74 -121.81 841.90 WA LONGMIRE RAINIER NPS USH00454769 46.15 -122.91 3.70 WA LONGVIEW USH00455224 47.13 -122.25 176.50 WA MC MILLIN RSVR USH00455946 48.91 -117.80 423.70 WA NORTHPORT USH00456039 47.32 -118.69 466.30 WA ODESSA USH00456096 48.61 -122.80 24.40 WA OLGA 2 SE USH00456610 46.46 -117.58 579.10 WA POMEROY USH00456624 48.11 -123.43 27.40 WA PORT ANGELES USH00456678 48.11 -122.75 30.50 WA PORT TOWNSEND USH00456789 46.75 -117.19 775.70 WA PULLMAN 2 NW USH00456914 46.65 -123.73 9.10 WA RAYMOND 2 S USH00457059 47.11 -118.37 557.80 WA RITZVILLE 1 SSE USH00457267 47.08 -117.59 592.80 WA SAINT JOHN USH00457458 47.65 -122.30 5.80 WA SEATTLE URBAN SITE USH00457507 48.49 -122.23 18.30 WA SEDRO WOOLLEY USH00457773 47.54 -121.83 134.10 WA SNOQUALMIE FALLS USH00457938 47.62 -117.52 717.20 WA SPOKANE INTL AP USH00458059 48.35 -120.72 387.10 WA STEHEKIN 4 NW USH00458207 46.32 -120.01 227.70 WA SUNNYSIDE USH00458773 45.67 -122.65 64.00 WA VANCOUVER 4 NNE USH00458928 46.10 -118.28 355.40 WA WALLA WALLA FAA AP USH00459012 47.64 -120.06 798.60 WA WATERVILLE USH00459074 47.42 -120.31 195.10 WA WENATCHEE USH00459238 47.75 -118.67 679.70 WA WILBUR USH00459376 48.45 -120.19 534.90 WA WINTHROP 1 WSW USH00461220 38.98 -80.22 443.50 WV BUCKHANNON USH00461330 39.20 -81.15 231.60 WV CAIRO USH00463544 38.93 -80.83 216.40 WV GLENVILLE USH00465224 37.85 -80.40 701.00 WV LEWISBURG 3 N USH00465626 39.54 -80.46 335.30 WV MANNINGTON 8 WNW USH00465707 39.40 -77.98 162.80 WV MARTINSBURG E WV RGNL USH00466867 39.10 -79.66 556.60 WV PARSONS 1 NE USH00466989 38.66 -80.20 877.80 WV PICKENS 2 N USH00467029 37.57 -81.53 390.10 WV PINEVILLE USH00468384 38.80 -81.36 287.40 WV SPENCER USH00469368 40.27 -80.61 201.20 WV WELLSBURG WTR TRMT PL USH00469610 37.67 -82.27 231.60 WV WILLIAMSON USH00469683 38.52 -81.91 186.20 WV WINFIELD LOCKS USH00470349 46.58 -90.96 198.10 WI ASHLAND EXP FARM USH00470991 44.85 -88.98 329.20 WI BOWLER USH00471078 42.61 -89.38 240.80 WI BRODHEAD USH00472001 42.67 -90.11 292.60 WI DARLINGTON USH00472839 43.79 -88.45 231.60 WI FOND DU LAC USH00473405 44.11 -89.53 331.90 WI HANCOCK EXP FARM USH00474546 42.82 -90.78 317.00 WI LANCASTER 4 WSW USH00475017 44.08 -87.65 178.00 WI MANITOWOC USH00475120 44.63 -90.13 377.00 WI MARSHFIELD EXP FARM USH00475255 45.13 -90.34 448.10 WI MEDFORD USH00475474 43.07 -88.02 221.30 WI MILWAUKEE MT MARY COL USH00475516 45.88 -89.73 488.00 WI MINOCQUA USH00475808 44.52 -90.63 310.90 WI NEILLSVILLE 3 SW USH00475932 44.35 -88.71 243.80 WI NEW LONDON USH00476208 44.88 -87.95 201.20 WI OCONTO 4 W USH00476330 44.02 -88.55 228.60 WI OSHKOSH USH00476718 43.52 -89.43 236.20 WI PORTAGE USH00476827 43.05 -91.13 200.60 WI PRAIRIE DU CHIEN USH00476922 42.70 -87.78 181.40 WI RACINE USH00478027 45.82 -91.87 335.30 WI SPOONER AG RES STN USH00478110 44.96 -90.93 332.20 WI STANLEY USH00478827 43.55 -90.87 382.50 WI VIROQUA USH00478919 43.17 -88.73 251.50 WI WATERTOWN USH00480140 43.77 -111.03 1962.00 WY ALTA 1 NNW USH00480540 44.37 -108.03 1169.50 WY BASIN USH00480552 42.63 -106.37 1831.80 WY BATES CREEK #2 USH00481675 41.15 -104.81 1868.40 WY CHEYENNE WSFO AP USH00481730 41.75 -104.82 1616.70 WY CHUGWATER USH00481840 44.52 -109.06 1549.00 WY CODY USH00481905 44.87 -104.15 1060.70 WY COLONY USH00482595 43.22 -108.94 1699.30 WY DIVERSION DAM USH00482715 43.53 -109.65 2119.90 WY DUBOIS USH00483100 41.26 -110.95 2080.30 WY EVANSTON 1 E USH00484065 41.53 -109.47 1852.30 WY GREEN RIVER USH00485345 44.56 -110.39 2398.80 WY LAKE YELLOWSTONE USH00485415 41.31 -105.67 2214.70 WY LARAMIE RGNL AP USH00485830 42.75 -104.48 1551.40 WY LUSK 2 SW USH00486195 43.41 -106.27 1481.30 WY MIDWEST USH00486440 43.85 -110.58 2072.00 WY MORAN 5 WNW USH00486660 43.85 -104.21 1315.20 WY NEWCASTLE USH00487115 43.24 -108.69 1658.10 WY PAVILLION USH00487240 41.17 -104.15 1578.90 WY PINE BLUFFS 5W USH00487260 42.87 -109.86 2193.00 WY PINEDALE USH00487388 44.77 -108.75 1332.00 WY POWELL FLD STN USH00487760 43.03 -108.37 1510.30 WY RIVERTON USH00487845 41.59 -109.06 2055.00 WY ROCK SPRINGS AP USH00487990 41.45 -106.80 2069.60 WY SARATOGA USH00488160 44.84 -106.83 1143.00 WY SHERIDAN FLD STN USH00488995 42.08 -104.22 1249.10 WY TORRINGTON EXP FARM USH00489615 42.11 -104.94 1413.70 WY WHEATLAND 4 N USH00489770 44.01 -107.96 1237.50 WY WORLAND USH00489905 44.97 -110.69 1898.90 WY YELLOWSTONE PK MAMMOTH
My closest station is the UT Utah Lake Lindon station.
The US Temperature Record 4: Data Flags
The data provided has flags you should understand. Definitions below are from the USHCN Status file.
Data Measurement Flag
                  blank = no measurement information applicable
                  a-i = number of days missing in calculation of monthly mean
                        temperature
		  E = The value is estimated using values from surrounding
		      stations because a monthly value could not be computed
		      from daily data; or,
                      the pairwise homogenization algorithm removed the value
		      because of too many apparent inhomogeneities occuring
		      close together in time.
Quality Control Flag
                  BLANK = no failure of quality control check or could not be
                          evaluated.

                  D = monthly value is part of an annual series of values that
                      are exactly the same (e.g. duplicated) within another
                      year in the station's record.

                  I = checks for internal consistency between TMAX and TMIN.
                      Flag is set when TMIN > TMAX for a given month.

                  L = monthly value is isolated in time within the station
                      record, and this is defined by having no immediate non-
                      missing values 18 months on either side of the value.

                  M = Manually flagged as erroneous.

                  O = monthly value that is >= 5 bi-weight standard deviations
                      from the bi-weight mean.  Bi-weight statistics are
                      calculated from a series of all non-missing values in
                      the station's record for that particular month.

                  S = monthly value has failed spatial consistency check.
                      Any value found to be between 2.5 and 5.0 bi-weight
                      standard deviations from the bi-weight mean, is more
                      closely scrutinized by exmaining the 5 closest neighbors
                      (not to exceed 500.0 km) and determine their associated
                      distribution of respective z-scores.  At least one of
                      the neighbor stations must have a z score with the same
                      sign as the target and its z-score must be greater than
                      or equal to the z-score listed in column B (below),
                      where column B is expressed as a function of the target
                      z-score ranges (column A).

                                  ----------------------------
                                       A       |        B
                                  ----------------------------
                                    4.0 - 5.0  |       1.9
                                  ----------------------------
                                    3.0 - 4.0  |       1.8
                                  ----------------------------
                                   2.75 - 3.0  |       1.7
                                  ----------------------------
                                   2.50 - 2.75 |       1.6


                  W = monthly value is duplicated from the previous month,
                      based upon regional and spatial criteria and is only
                      applied from the year 2000 to the present.

                  Quality Controlled Adjusted (QCA) QC Flags:

                  A = alternative method of adjustment used.

                  M = values with a non-blank quality control flag in the "qcu"
                      dataset are set to missing the adjusted dataset and given
                      an "M" quality control flag.
Data Source Flag
                  Blank = Value was computed from daily data available in GHCN-Daily

	          Not Blank = Daily data are not available so the monthly value was
		              obtained from the USHCN version 1 dataset.  The possible
			      Version 1 DSFLAGS are as follows:

                              1 =  NCDC Tape Deck 3220, Summary of the Month Element Digital File
	                      2 =  Means Book - Smithsonian Institute, C.A. Schott (1876, 1881 thru 1931)
                              3 =  Manuscript - Original Records, National Climatic Data Center
                              4 =  Climatological Data (CD), monthly NCDC publication
                              5 =  Climate Record Book, as described in History of Climatological Record
		                   Books, U.S. Department of Commerce, Weather Bureau, USGPO (1960)
                              6 =  Bulletin W - Summary of the Climatological Data for the United States (by
                                   section), F.H. Bigelow, U.S. Weather Bureau (1912); and, Bulletin W -
                                   Summary of the Climatological Data for the United States, 2nd Ed.
                              7 =  Local Climatological Data (LCD), monthly NCDC publication
                              8 =  State Climatologists, various sources
                              B =  Professor Raymond Bradley - Refer to Climatic Fluctuations of the Western
                                   United States During the Period of Instrumental Records, Bradley, et. al.,
                                   Contribution No. 42, Dept. of Geography and Geology, University of
                                   Massachusetts (1982)
                              D =  Dr. Henry Diaz, a compilation of data from Bulletin W, LCD, and NCDC Tape
                                   Deck 3220 (1983)
                              G =  Professor John Griffiths - primarily from Climatological Data
Most of these flags I ignore because they either won't change the annual averages or they are the consequence of an opinion. The only flag I care about is the I flag, meaning the reported Tmin is larger than the Tmax for that month. I'll report later how many flags there are in the example dataset I'll use.
The US Temperature Record 5: Preparing the Data
- Chose the dataset you want to use. I use the raw data because as a chemist I learned to use the data I recorded, and any fiddling you want to do needs to be done in the model. I'll be comparing the data later in this series. As an example, I'll use the tmax.raw data. Grab the file from https://www.ncei.noaa.gov/pub/data/ushcn/v2.5/ (about 5 MB), which has the .tar.gz extension. Most zip programs can open this, and you'll need to drill into the directory structure (four-levels deep!) and unzip the .txt files in its own directory. I named mine tmax.raw. It contains 1200+ files.
- Concantate all the files into a single text file named tmax.raw.txt by first opening a command line window (windows-R, "cmd", enter) and navigate to the folder you just created:
cd downloads
cd ushcn
cd tmax.raw
dir (to confirm files are there)
copy *.* Tmax.raw.txt
- This creates a file, Tmax.raw.txt, which is about 18 MB long.
- Import this data into a database program. I'll use MS Access, but libreBase works also. A spreadsheet won't work too well because we'll need to average all temperature readings for each year. The import function needs to define the columns of the data. Here is the list of the data columns, and there are a lot of them:
Variable Columns Type -------- ------- ---- ID 1-11 Integer YEAR 13-16 Integer VALUE1 17-22 Integer DMFLAG1 23-23 Character QCFLAG1 24-24 Character DSFLAG1 25-25 Character . . . . . . . . . VALUE12 116-121 Integer DMFLAG12 122-122 Character QCFLAG12 123-123 Character DSFLAG12 124-124 Character Variable Definitions: ID: 11 character alfanumeric identifier: characters 1-2=Country Code ('US' for all USHCN stations) character 3=Network code ('H' for Historical Climatology Network) digits 4-11='00'+6-digit Cooperative Observer Identification Number YEAR: 4 digit year of the station record. VALUE: monthly value (MISSING=-9999). Temperature values are in hundredths of a degree Celsius, but are expressed as whole integers (e.g. divide by 100.0 to get whole degrees Celsius). Precipitation values are in tenths of millimeters, but are also expressed as whole integers (e.g. divide by 10.0 to get millimeters). - And repeat this process for any other datasets you want to graph. Create each in a new table of the database. You can save the import format (they call it the "import specification") so the subsequent imports are much easier than setting up the first. Each data table will be about 150,000 rows long, each representing one station's monthly averages for that year. What I did was build one import specification, then used that same "spec." for each dataset. They all have the same format. I'd name the resulting table as whatever it was (Tmax-raw, Tavg-TOB for example).
- Now, they didn't make this easy. Whenever a value is not known, they used the value -9999. All those need to be changed to [null] using the search-and-replace function; just leave the new value blank. I needed to do that several times per table to get them all changed.
- If you want to do what I'm doing by importing every dataset, plan to spend some time at it. The resulting .accdb file will be quite large, 325 MB. Maybe I'll update this file each year and make it available for download. Depends how well it compresses. These don't need to be updated often; the time base for climate change is very long, decades. Annual updates are more than often enough.
The US Temperature Record 6: Extracting annual averages using SQL
For our example I'm going to use Microsoft Access and the SQL language to make the create the yearly averages. This might also be very doable using a pivot table in Excel, but I don't know the intricacies of pivot table usage. In fact, pivot tables might be a great deal easier to use than Access/SQL, particularly if you can link the Excel data directly back to the .txt files, making the data refreshes each year very easy to do (well, you can do the same with Access, but I didn't).
In Access, we will now produce the annual averages for all stations in the U.S. using SQL, Structured Query Language. SQL is used to ask a database to produce specific data, and we will use the aggregate functions to get the averages over all stations.
It's actually more complex than that, because the thing we are aggregating is the yearly average,
([jan]+[feb]+[mar]+[apr]+[jun]+[jul]+[aug]+[sep]+[oct]+[nov]+[dec])/1200
Or as I designate the months columns in the Access database,
([M1]+[M2]+[M3]+[M4]+[M5]+[M6]+[M7]+[M8]+[M9]+[M10]+[M11]+[M12])/1200
Dividing by 1200 does two things: divides by 12 to get the annual average, and convert the temperature in centi-centigrade back to temperature in degrees centigrade (a "grade" being the difference in temperature between the freezing point and boiling point of water). So at this point we have a yearly average for each station for each year. This can be modified as
(([M1]+[M2]+[M3]+[M4]+[M5]+[M6]+[M7]+[M8]+[M9]+[M10]+[M11]+[M12])*9/5/100/12 + 32)
or
(([M1]+[M2]+[M3]+[M4]+[M5]+[M6]+[M7]+[M8]+[M9]+[M10]+[M11]+[M12])*0.0015 + 32)
to produce the temperatures in degrees Fahrenheit.
The aggregate function, GROUP BY Year, then averages all the years together to produce the single national average for all the annual averages.
The overall SQL statement is
SELECT t.Year, Avg(([M1]+[M2]+[M3]+[M4]+[M5]+[M6]+[M7]+[M8]+[M9]+[M10]+[M11]+[M12])*0.0015 + 32) AS TavgRawAnnualFROM [TAVG-RAW] AS tGROUP BY t.Year;
and for precipitation,
SELECT t.Year, Avg(([M1]+[M2]+[M3]+[M4]+[M5]+[M6]+[M7]+[M8]+[M9]+[M10]+[M11]+[M12])/1200) AS PRCPRawAnnualFROM [PRCP-RAW] AS tGROUP BY t.Year;
The name of the calculated column (here "TavgRawAnnual") and the table from which the data comes ("TAVG-RAW") need to be changes when using a different data set. I'm using an alias for the table name, "t," so that I don't need to change too much when I copy the SQL statement. This statement will produce a list of the nation-side average temperatures for each year. I create a query like this for each table I have. The data goes into an Excel sheet for graphing.
If you want the data for a particular month, the August highs each year, for example, you can simplify the query,
SELECT t.Year, Avg([M8]*0.018 + 32) AS TmaxRawAugustFROM [TMAX-RAW] AS tGROUP BY t.Year;
The US Temperature Record 7: Graphing annual data in Excel
Copy and past the annual temperature averages from the Access query into an excel sheet.
You can use a "Scatter with Straight Lines" plot to display the data.
Here is a problem: the data from before 1890 is pretty sparse, and moves around a lot annually. To get a better representation of the trend, it's best to delete it. But that's up to you. What I do is select and cut the deviant data and paste it into the next-door column, so I can put it back if I need to. I'll talk about removing early data in a future post.
Then fit a linear trend, display the trend line and equation. The slope of the trend will be the trend in degrees Fahrenheit per year. If it's negative, the temperature trend is cooling. if it's positive, the trend is rising. Take the reciprocal (1/x) to get the trend slope in number-of-year-to-raise-one-degree.
Here is an example:
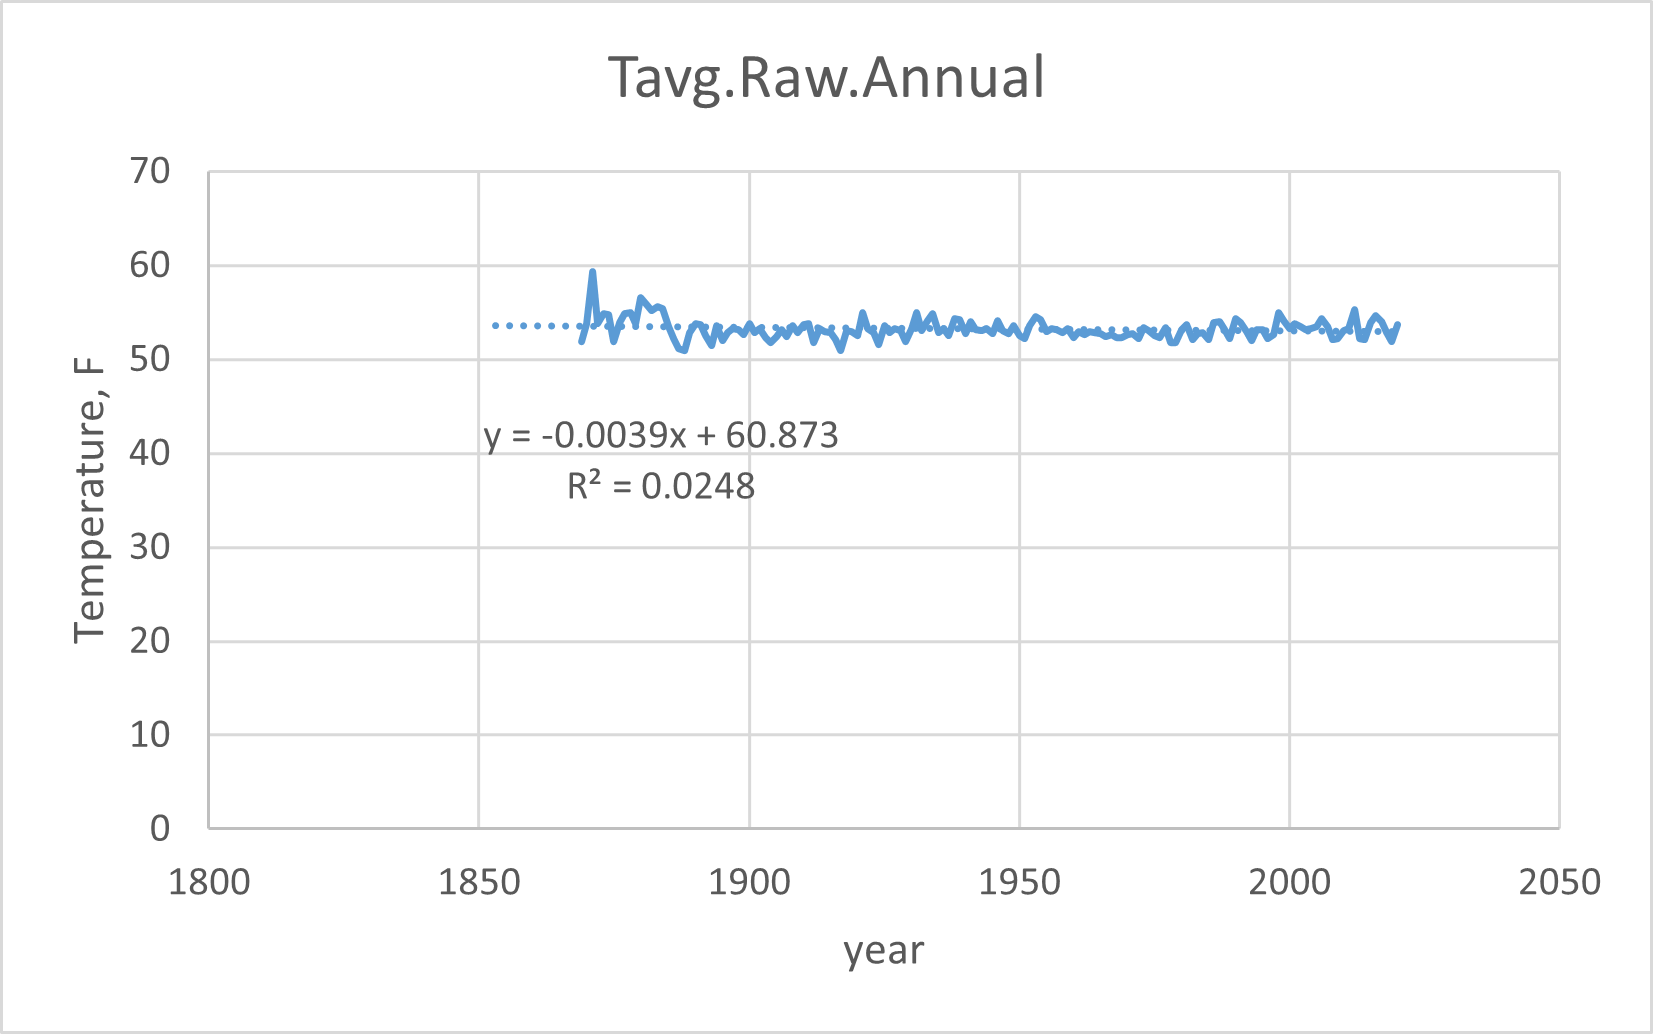
Or you can change the vertical axis to emphasize the ups-and-downs of the data:
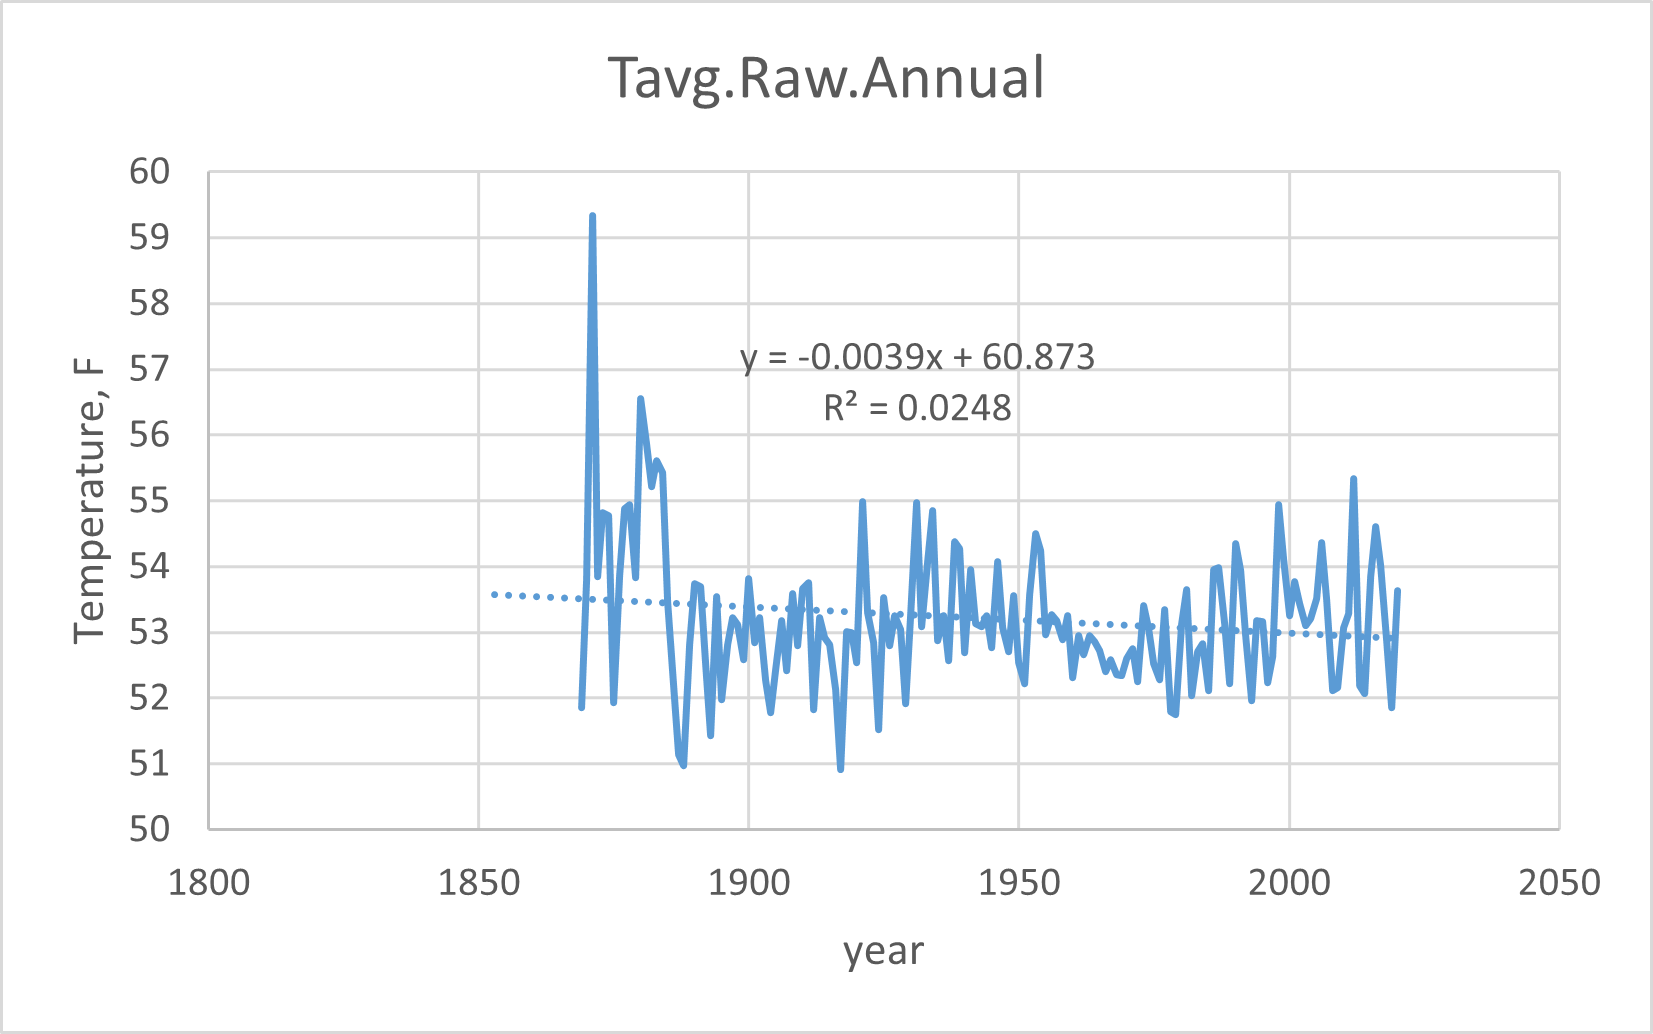
I'm selecting the graph, right-click, Save as picture... to save these as .png files.
The US Temperature Record 8: Choosing a dataset
There are three USHCN datasets: RAW, TOB, and FLs.52j. I'll discus what each is, and which I will use to observe the US Temperature record.
- RAW is the thermometer high and low recorded for each day, sent in on monthly station sheets. This is recorded as a high and low, Tmax and Tmin, and an average, Tavg = (Tmax- Tmin)/2. The time of day is recorded, and the recording thermometer reset.
- TOB is raw temperature data corrected for the Time of OBservation, to place the high temperature on the correct day if the observation was recorded before the peak temperature of the day. This correction should have no effect on the monthly averages if the time of observation each day is consistent.
- FLs.52j is the result of the "pairwise homogenization algorithm," the PHA. This is version 2.5, 10th (jth) revision. This needs some explanation.
The PHA has been discussed in five papers from 2009 to 2013, all long, all complex. I'll do my best to tell you what they said. Here are the publications, available from the USHCN download site.
- menne-williams2009.pdf (2.06 mb) Introduces the PHA
- menne-etal2012.pdf (4.36 mb) Discusses the PHA-adjusted data from the Global Historical Data Network
- williams-etal2012.pdf (1.61 mb) Benchmarking the PHA with fake data
- vose-etal2012.pdf (1.08 mb) Compares the PHA data to six other PHA-adjusted datasets
- hausfather-etal2013.pdf (801.33 kb) The effect of urbanization on increasing the PHA temperatures
1. Menne and Williams, Journal of Climate, 2009, volume 22, page 1700.
Abstract:
An automated homogenization algorithm based on the pairwise comparison of monthly temperature series is described. The algorithm works by forming pairwise difference series between serial monthly temperature values from a network of observing stations. Each difference series is then evaluated for undocumented shifts, and the station series responsible for such breaks is identified automatically. The algorithm also makes use of station history information, when available, to improve the identification of artificial shifts in temperature data. In addition, an evaluation is carried out to distinguish trend inhomogeneities from abrupt shifts. When the magnitude of an apparent shift attributed to a particular station can be reliably estimated, an adjustment is made for the target series. The pairwise algorithm is shown to be robust and efficient at detecting undocumented step changes under a variety of simulated scenarios with step- and trend-type inhomogeneities. Moreover, the approach is shown to yield a lower false-alarm rate for undocumented changepoint detection relative to the more common use of a reference series. Results from the algorithm are used to assess evidence for trend inhomogeneities in U.S. monthly temperature data.
On the assumption that some stations will change the temperature trend because something around the stations changed (land use changed which causes a jump in the trend, or the thermometer was replaced), the Pairwise Homogenization Algorithm will automatically detect and correct for the jump.
I have a problem with this. Which data set is the best, before the jump, or after? This is a problem with automated data corrections. And this can be a massive correction. Here is the opening paragraph:
Discontinuities in a climate series can be induced by virtually any change in instrumentation or observation practice. The relocation, replacement, or recalibration of an instrument, for example, can lead to an abrupt shift in time-ordered observations that is unrelated to any real change in climate. Likewise, alterations to the land use or land cover surrounding a measurement site might induce a sudden or ‘‘creeping’’ change (Carretero et al. 1998; Karl et al. 1988) that could limit the degree to which observations are representative of a particular region. Such artifacts in the climate record ultimately confound attempts to quantify climate variability and change (Thorne et al. 2005). Unfortunately, changes to the circumstances behind a series of climate observations are practically inevitable at some point during the period of record. For this reason, testing for artificial discontinuities or ‘‘inhomogeneities’’ is an essential component of climate analysis.Often, the test results can then be used to adjust a series so that it more closely reflects only variations in weather and climate.
So, what size of discontinuity are we looking for? A new thermometer, or recalibrating the old, maybe a tenth of a degree. Changing the location of the weather station, maybe a degree, if you move it away from new black tarmac to grass. What size are they correcting? Fourteen degrees! These are massive corrections, as they demonstrate with data from a station in Colorado.
Here is what the PHA does:
The pairwise algorithm is executed according to the following six steps:
- Select a set of "neighbors" for each "target" series in the network, and form pairwise difference series between the target and its neighbors.
- Identify the timing of shifts in all target-minus-neighbor difference series using SNHT.
- Verify each apparent shift identified by SNHT in the pairwise differences (e.g., does the apparent shift look more like a trend?).
- Attribute the cause of shifts in the set of target-minus-neighbor difference series to the various "culprit" series.
- Quantify the uncertainty in the timing of shifts attributed to each culprit series.
- Estimate the magnitude of the identified shifts for use in adjusting the temperature series to reflect the true background climate signal.
It is the assumption behind step 6 that gives me the willies. The "true background climate signal" presupposes that there is a global or continental trend in temperatures, and they seem to be using the adjusted data to show what that "background climate signal" is. They might also be using the results of climate models with heavy CO2 "forcings" (limits in the model by forcing the model to respond to changes in carbon dioxide levels, whether those changes are present or not) to generate that "background climate signal." We'll be testing this below.
The consequence of either the presupposition or the forcing is that the climatologist using this model will need to judge how well the PHA did in "correcting" the data, and that depends entirely on whether or not they think the climate is changing. We have departed from empirical data, and have moved into the home of experimenter bias. This sequence of steps involves choice, and that choice, by a human, cannot be done without moving from observation to fantasy. An idea drilled into my head during my PhD in chemistry: never mess with the data beyond graphing it; only trouble lies beyond. I watched as Steven Ragsdale at Nebraska did exactly this and had to withdraw four papers, two from Science, the most prestigious science journal in the U.S. and two from the Journal of the American Chemical Society, the most prestigious chemistry journal in the world. You never mess with your primary observations and you trust what they tell you.
That they are on version 2.5 revision 10 shows they are messing with the adjustment a lot!
The PHA messes with the primary temperature observations. Let's see how much. Rather than try to critique each paper, which would take me many days and much explaining, lets just look at the data. I'll use the Tavg data, because that includes both the Tmax and Tmin observations.
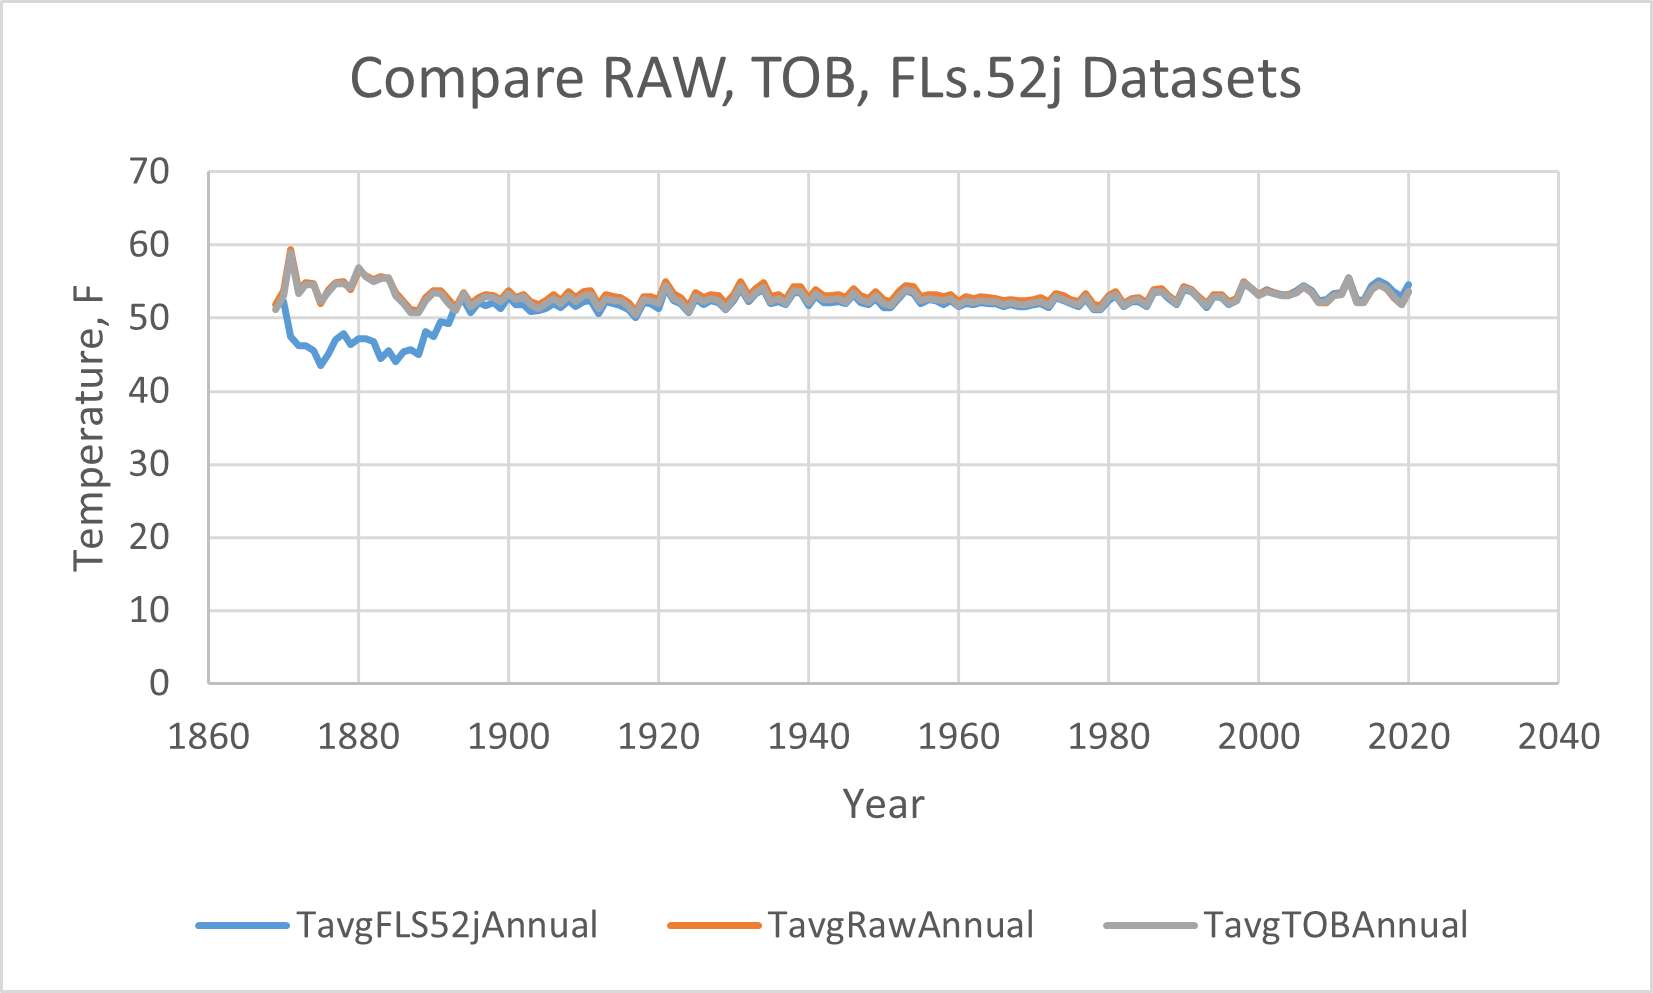
And blow up the vertical axis to see the differences,

That is one crazy "adjustment." The TOB (in grey) has lowered the temperatures from 1890 through about 2004, mostly in the middle of the range, by about 0.6 °F. TOB correction should not have had this dramatic an effect. These are monthly averages, and adjusting the date by one should not have had this large an effect. I suspect they are using their "judgment" to chose which data to shift. You notice no changes by the TOB correction happen after 2004, when the network was digitized and reported each hour.
But the PHA adjustment (in blue) is massive! It's doing two things: dramatically (over ten degrees!) lowering the temperatures in the past, and raising the temperatures since 2004. My biggest problem is with any change happening after 2004 when the thermometers were all good and they had data each hour. Lets take a closer look at the differences, subtracting each adjusted dataset from the RAW observed dataset, where the x-axis represents the raw temperature data, so we can see just how big each adjustment is, year by year:
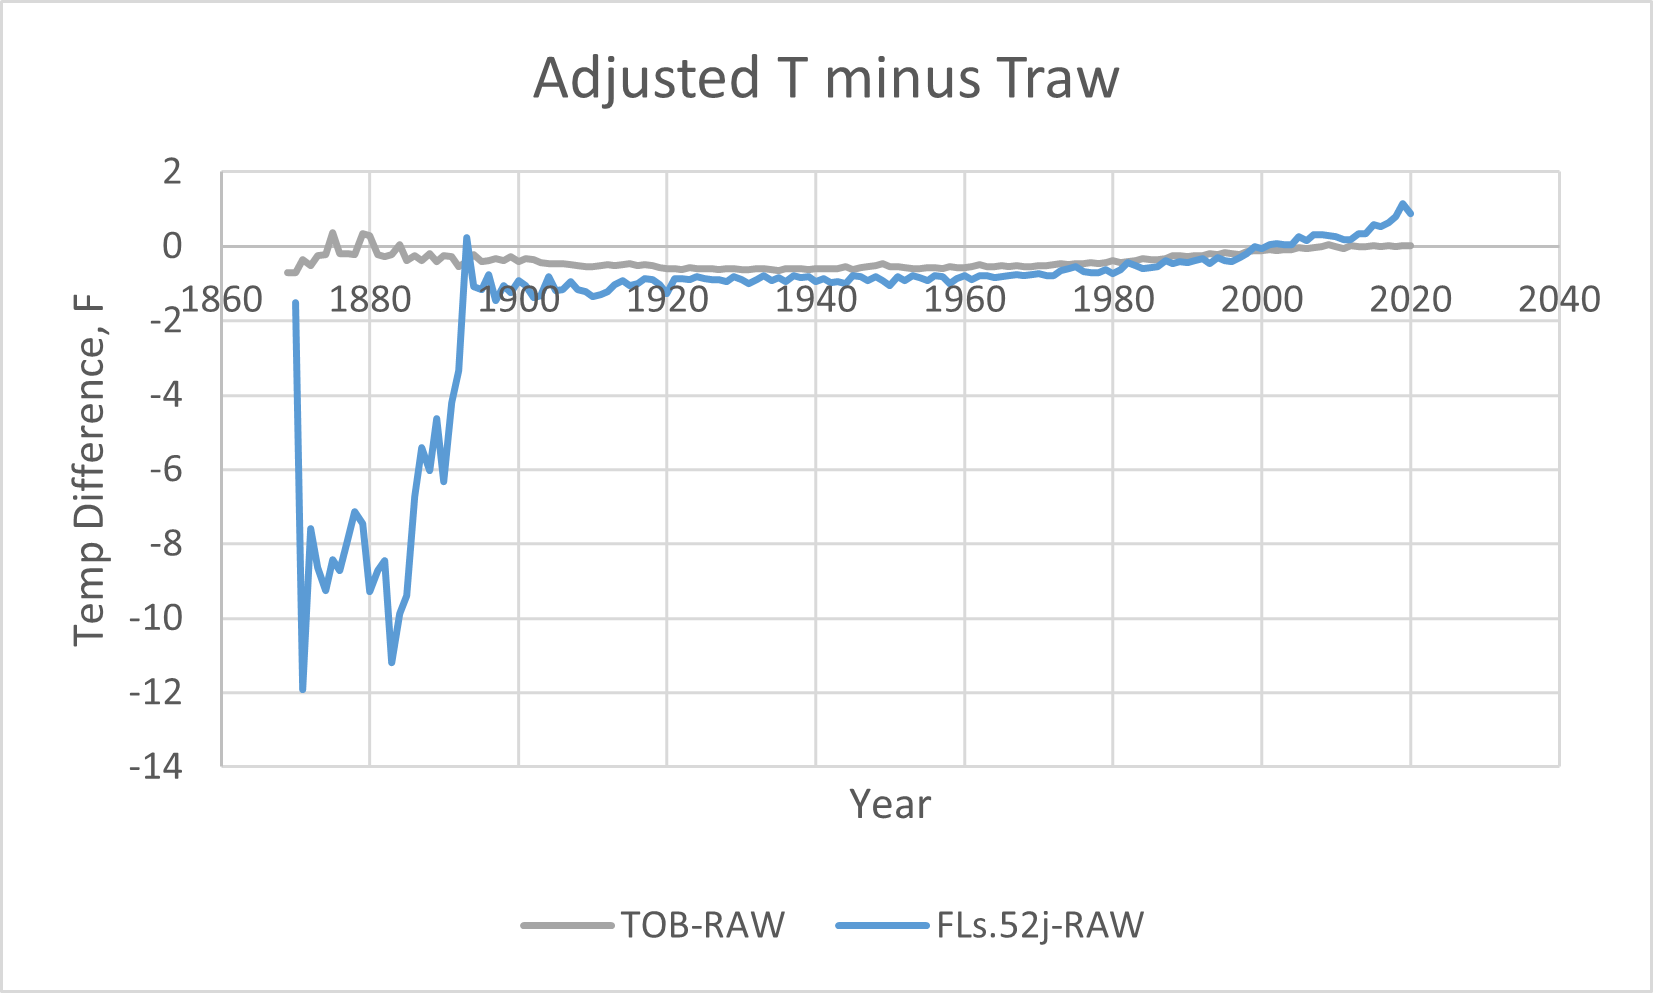
And zooming in,
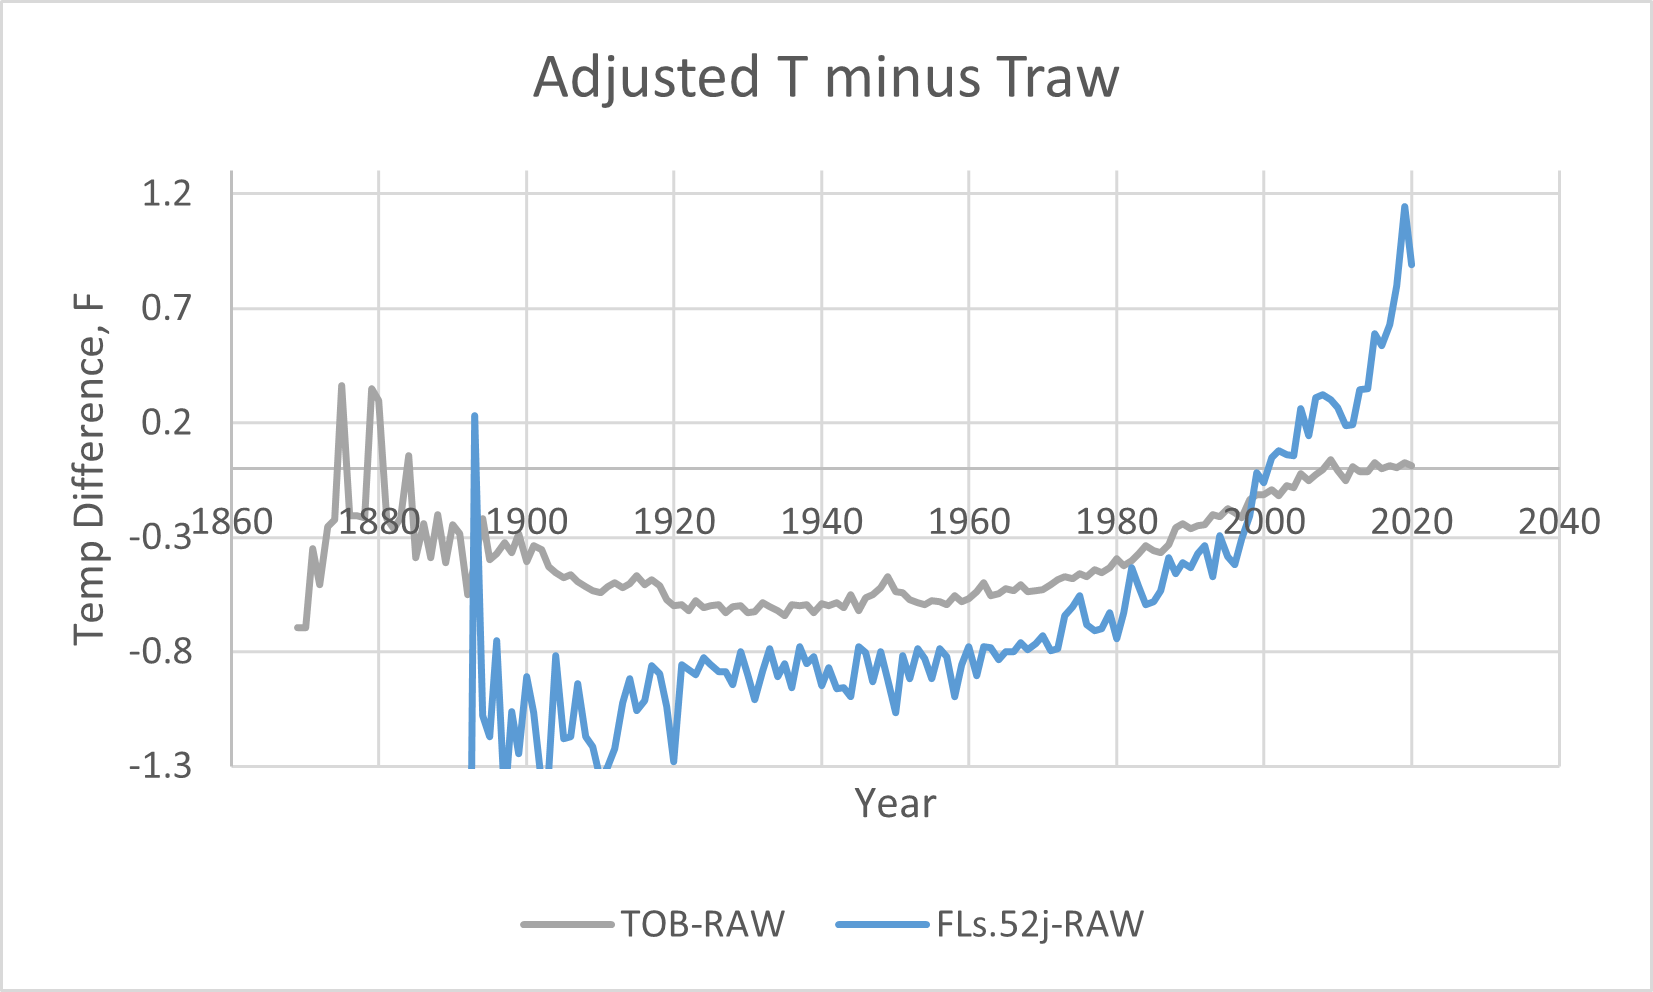
No one can look at these corrections and say, "Oh, that's pretty reasonable." The 12 degree (!) adjustment before 1890 is just crazy, and must be false. That alone disqualifies this data set. But more disturbing is the rest of the correction they applied to the thermometer data to create the PHA dataset. The temperatures before about 2002 are all lowered significantly, and the temperatures after 2002 are all significantly raised, far beyond the thermometer observations. This makes the temperature curve look like it's warming significantly. The PHA adjustment to me looks like climate alarmist wishful thinking. It's just not real. It says that thermometers across the US in 2019 all read 1.2 degrees too low, or if only a subset of bad thermometers are out there, they are reading many degrees too low. The most recent data is the best thermometer data we have, and that correction is growing, not shrinking! That's just not believable.
The TOB adjustment looks hinky to me also, especially since they are making that adjustment well after the automation of the weather stations which report every hour. After automation by 1989, there should be no TOB correction; the adjustment is still there, which means they are adjusting something other than time of observation.
Is the PHA correction the wishful thinking of the climatologists? Lets look at the carbon dioxide concentrations in the air, measured at the Mauna Loa Observatory, Hawaii, as far back as they have measured:
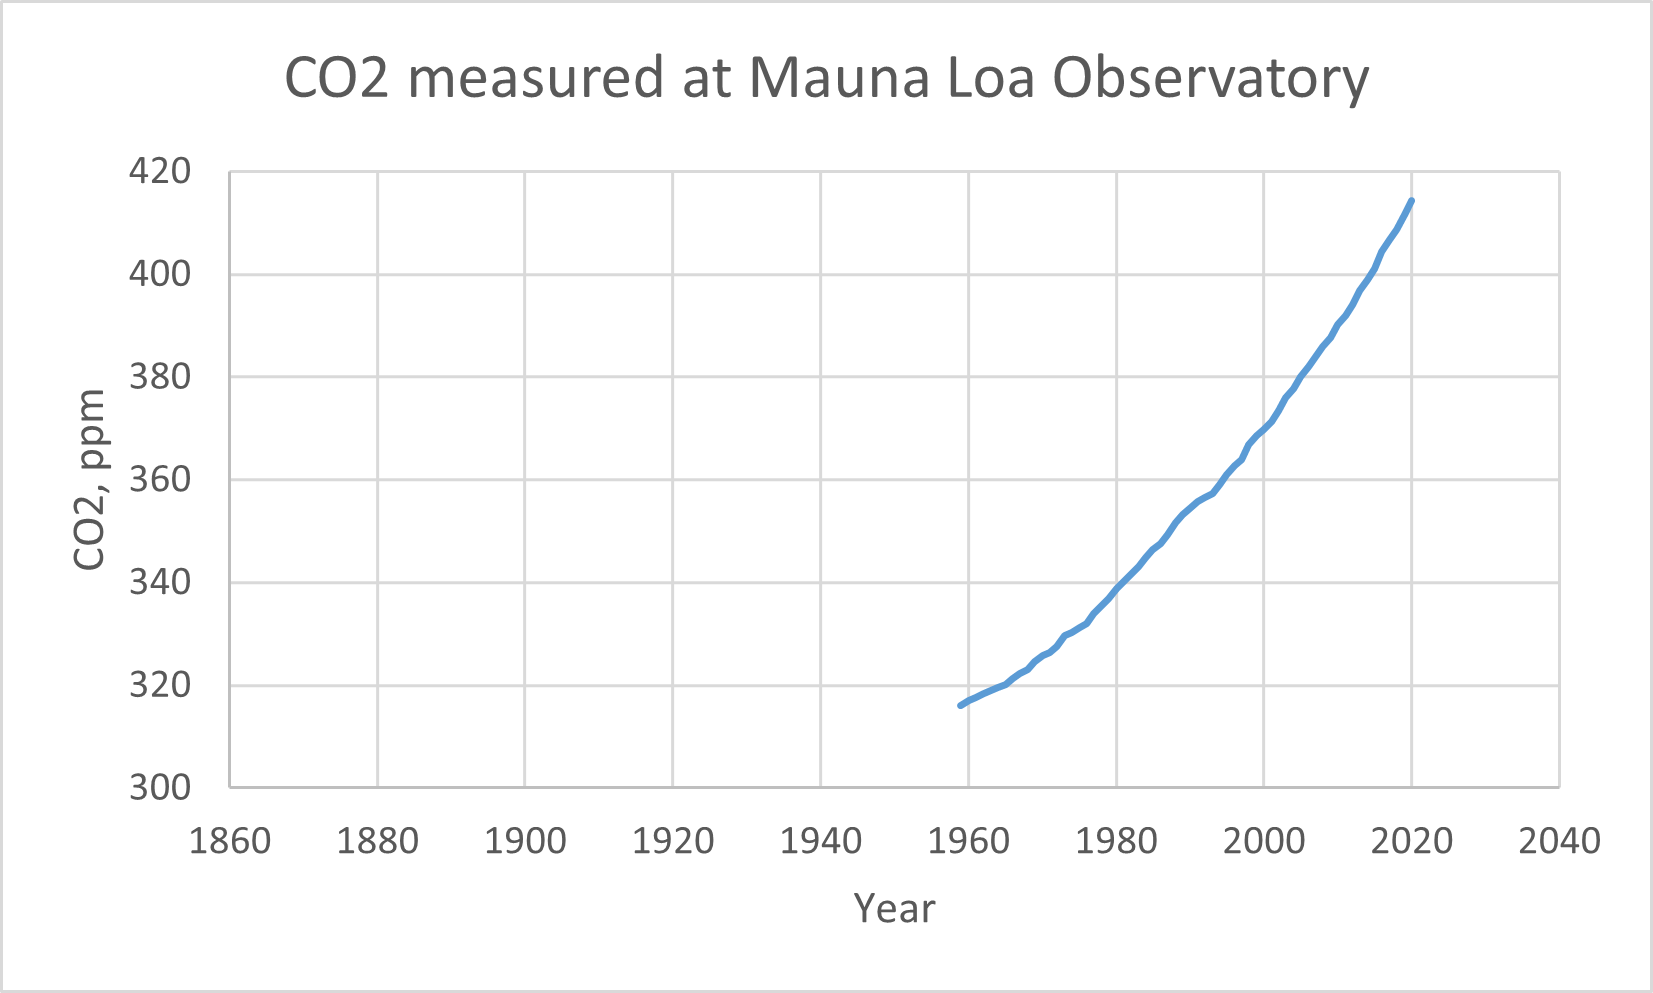
The CO2 curve is the same as the TPHA - TRAW curve! I think the PHA exists only to make the temperature record look like the CO2 curve. The PHA is fake.
I'm going to use only the RAW dataset, the recorded thermometer reading. No fiddling, no adjustments. Just the thermometer readings.
Here is the data, the Access database and the Excel file: USHCN2020.zip (71.80 mb)
The US Temperature Record 9: Data Cleanup
I'll be using only the RAW datasets, the recorded thermometer readings, with no adjustments. Here they are:
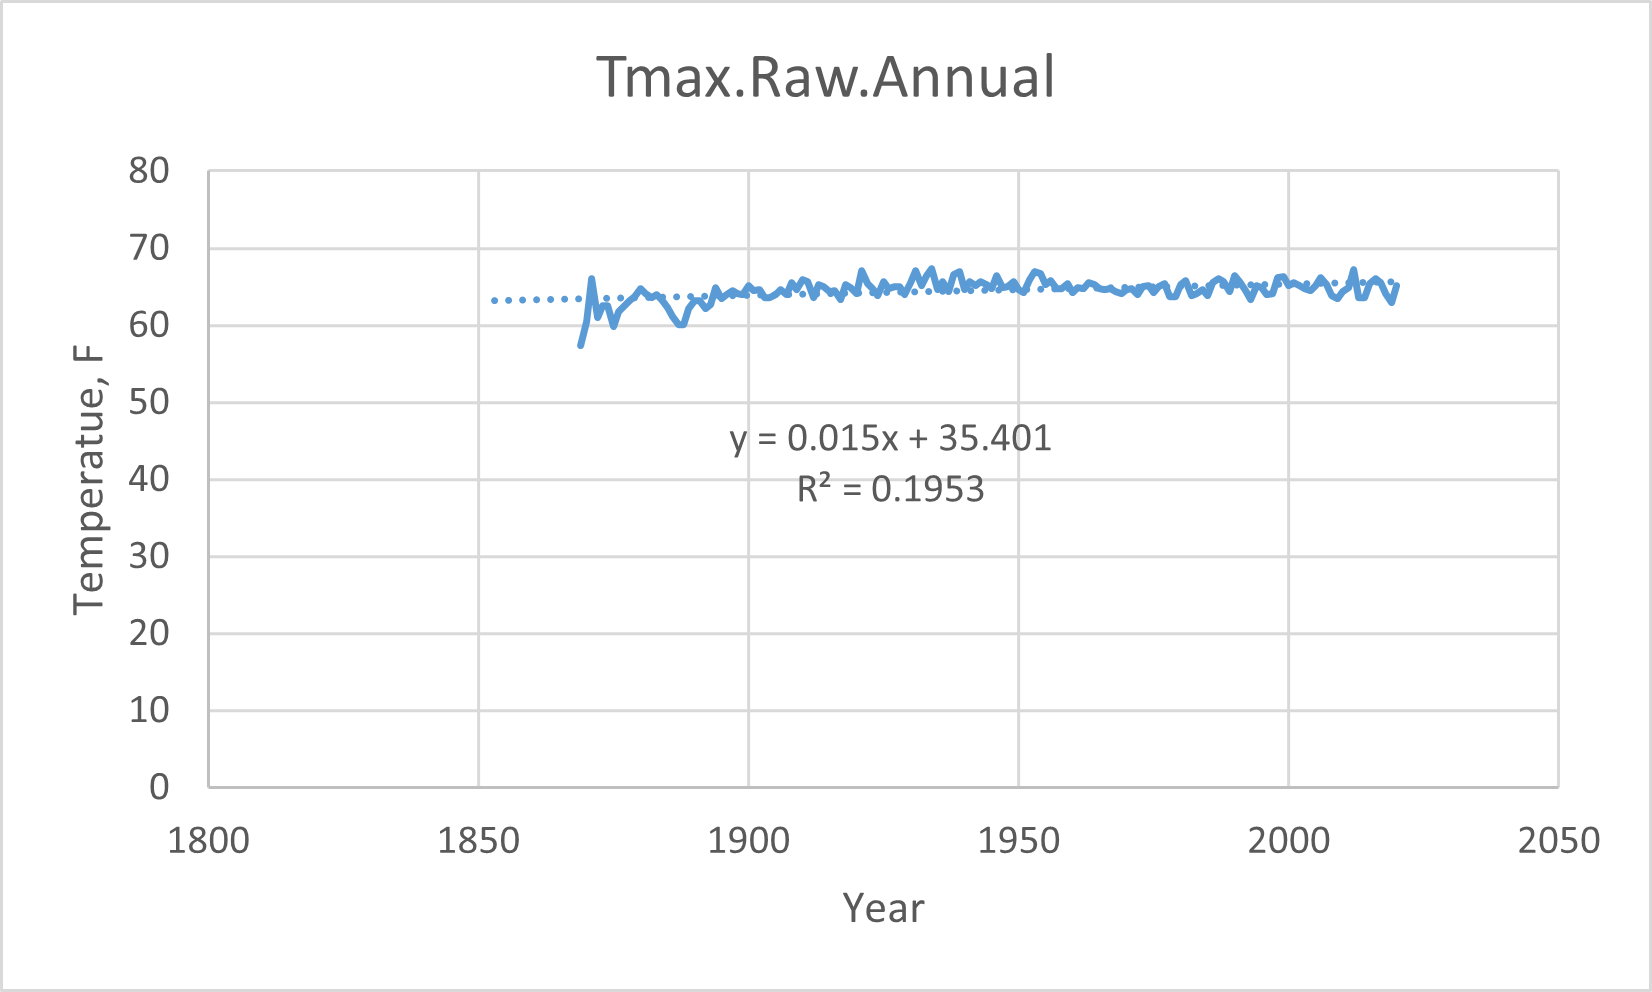
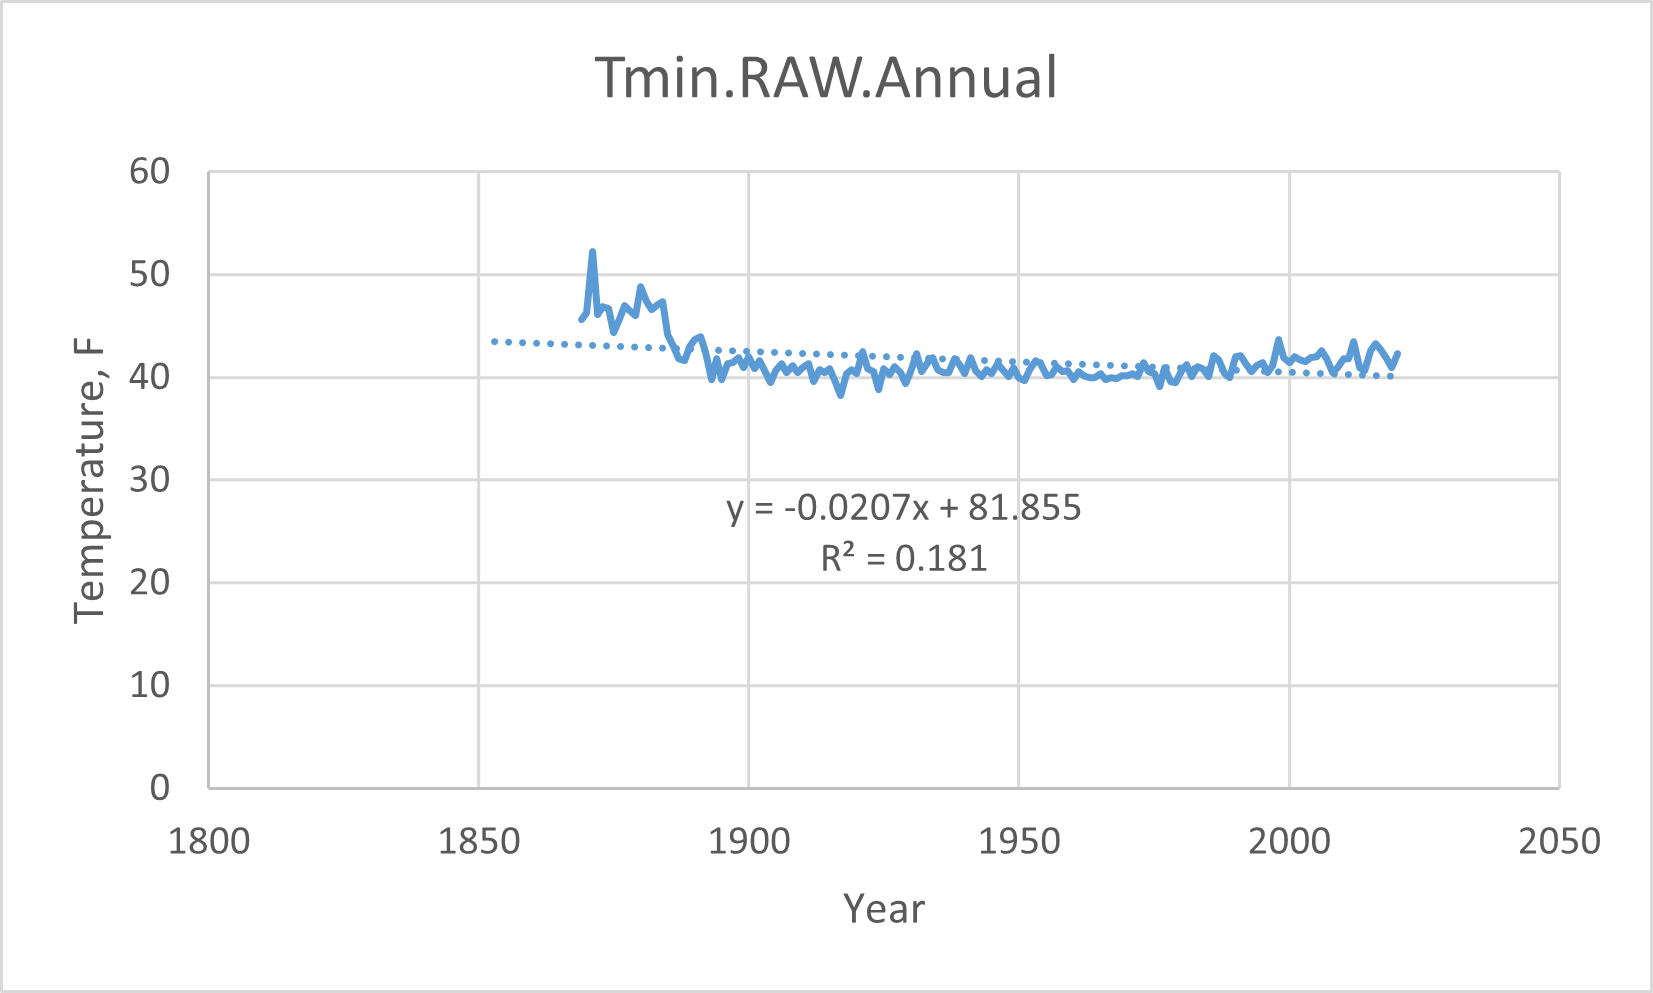
As you can see, there is quite a large variability at the beginning of the record, enough to throw off the slopes of the linear fit. I'm uncertain the best way to handle it. My first impression is to delete the record before 1890, after which the variability diminishes. Tavg and Tmin are certainly being influenced by the pre-1890 data. Deleting that data gives us a good 130-year temperature timeline, minimally enough to see what's happening to the climate.
That's what I'll do before assessing the trends in the US temperature record.
The US Temperature Record 10: The Trends
Finally, we are here. Previously I've explained how to find the data, get it into a database, pull the annual data out and into Excel for graphing, and which dataset is the most reliable, and how to clean up the pre-1890 data. Time to see the results!
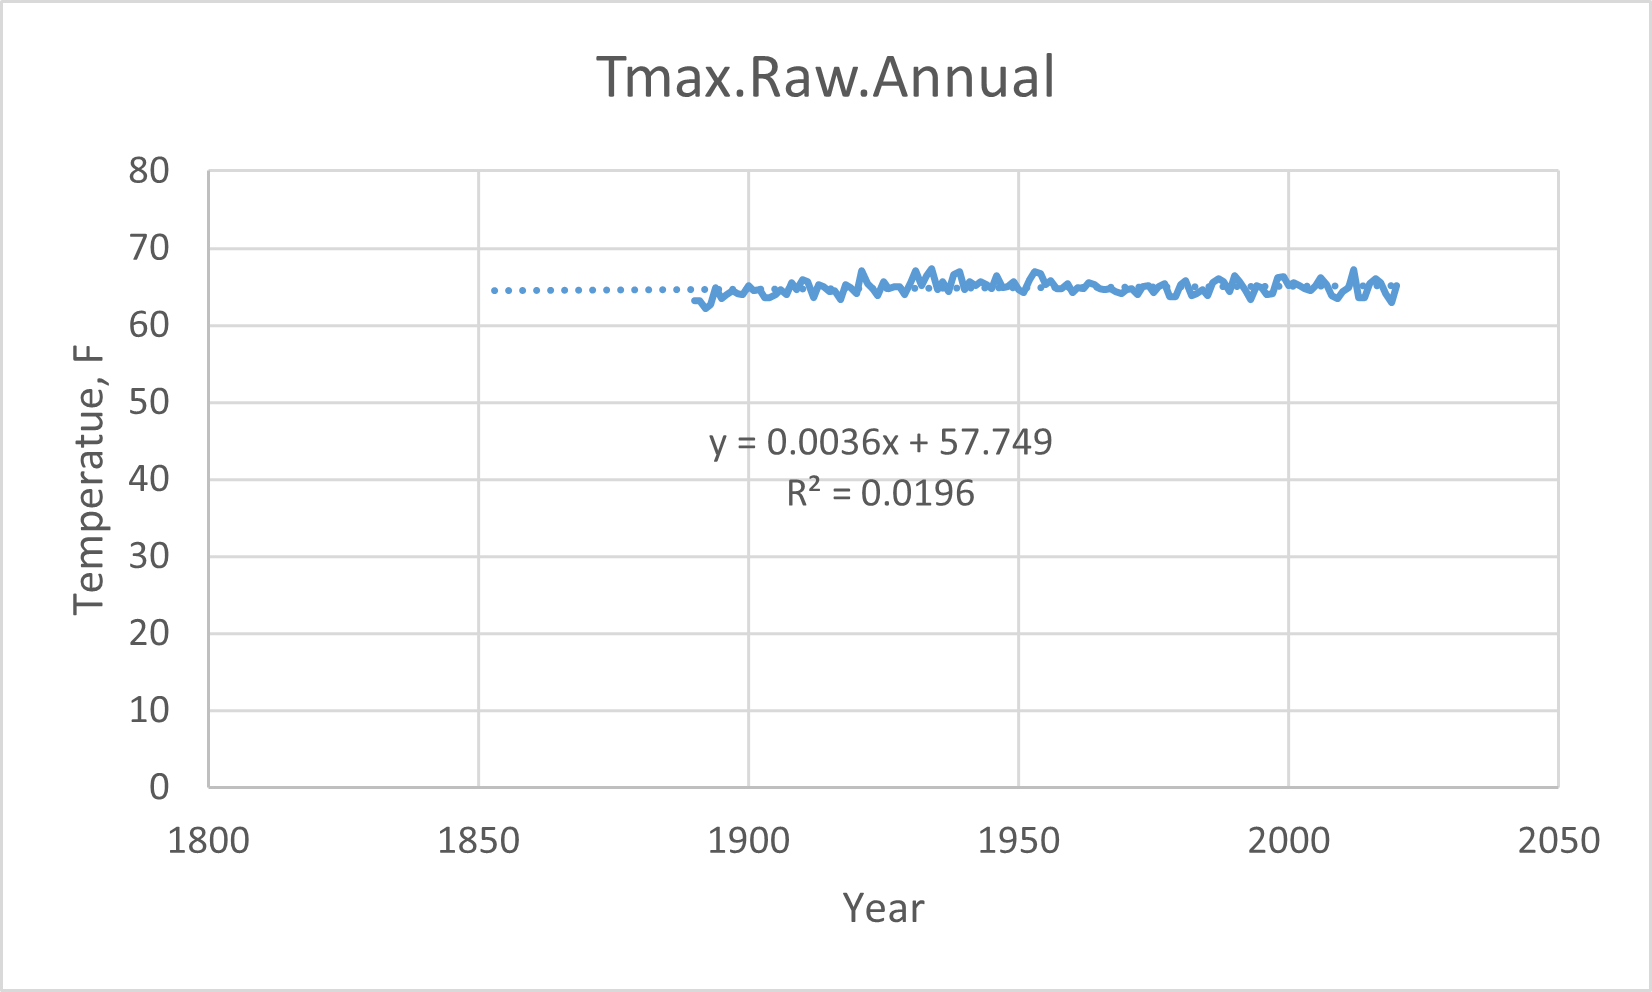
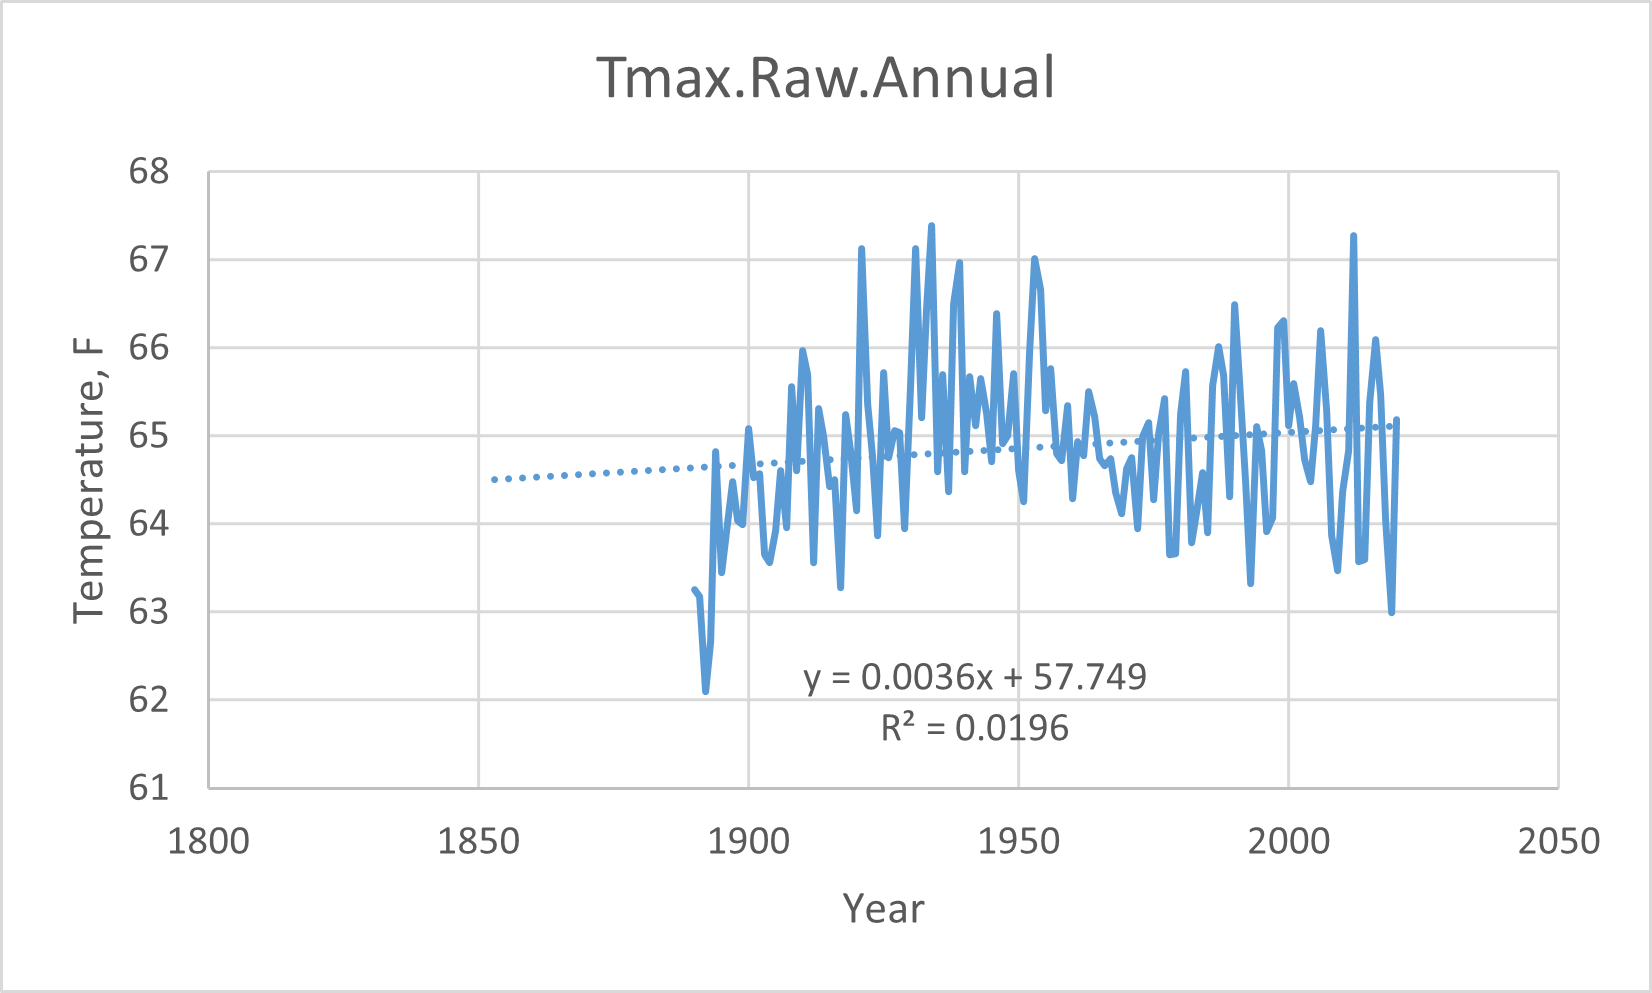
High temperatures each day going up at a rate of one degree F every 280 years (or one degree C every 500 years).

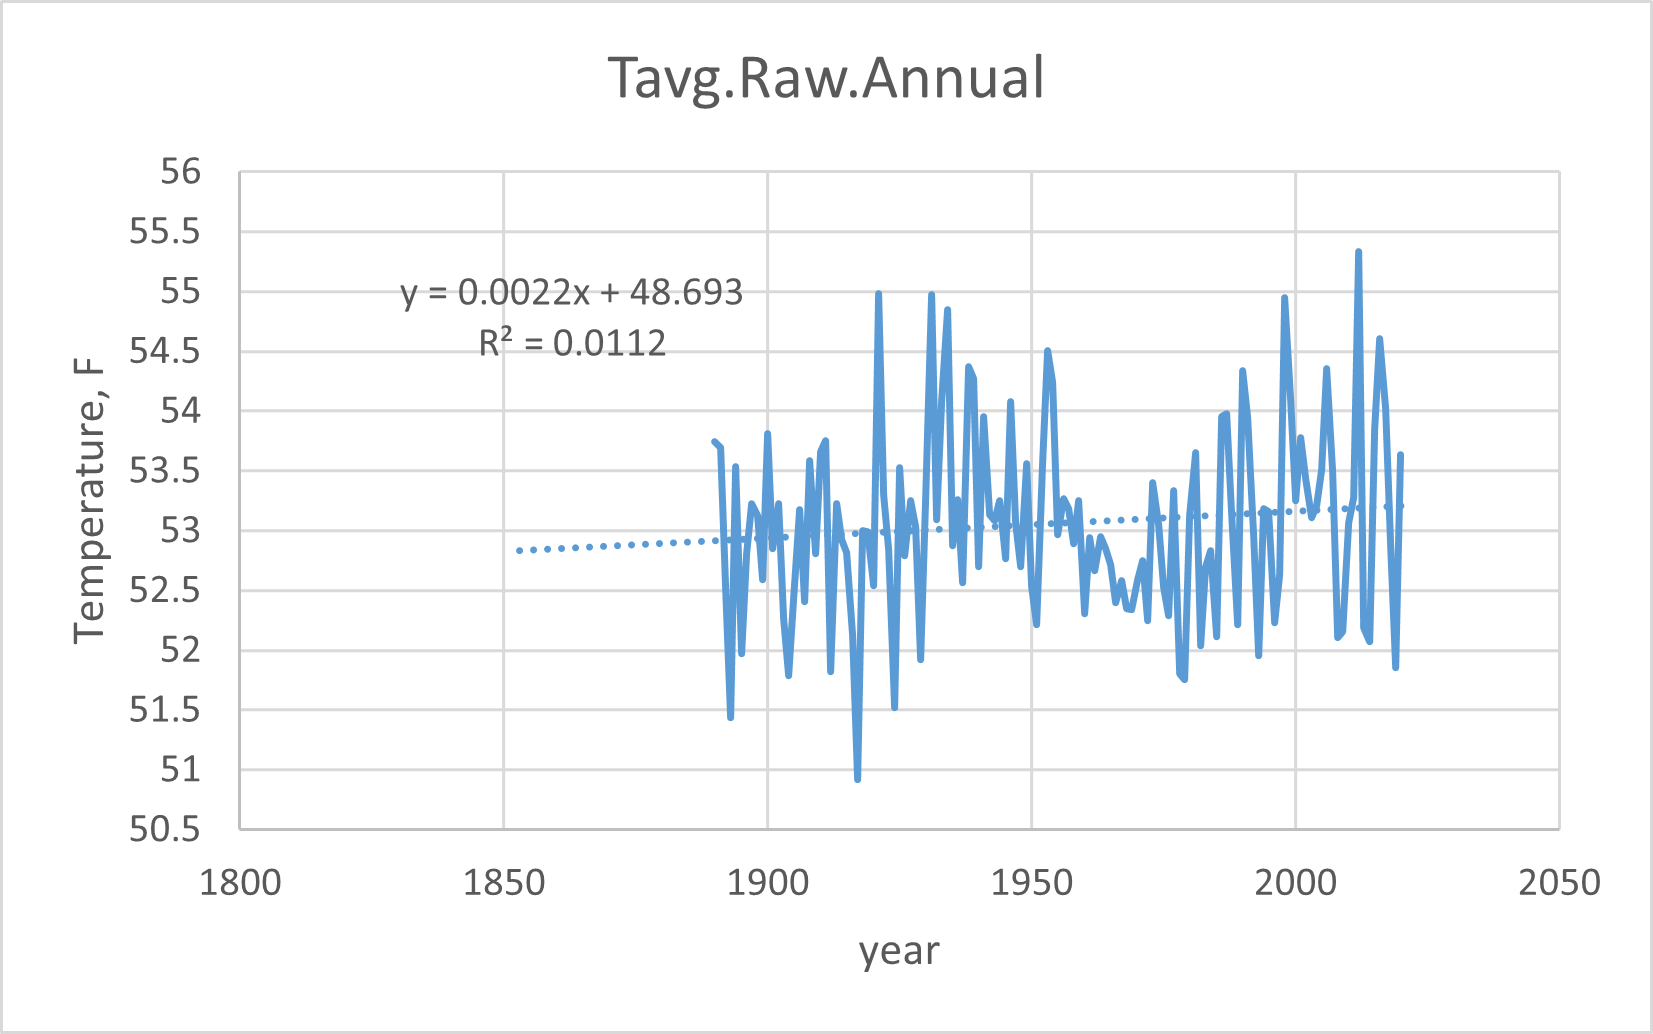
The average temperatures are going up at a rate of one degree F every 450 years (one degree C every 820 years).
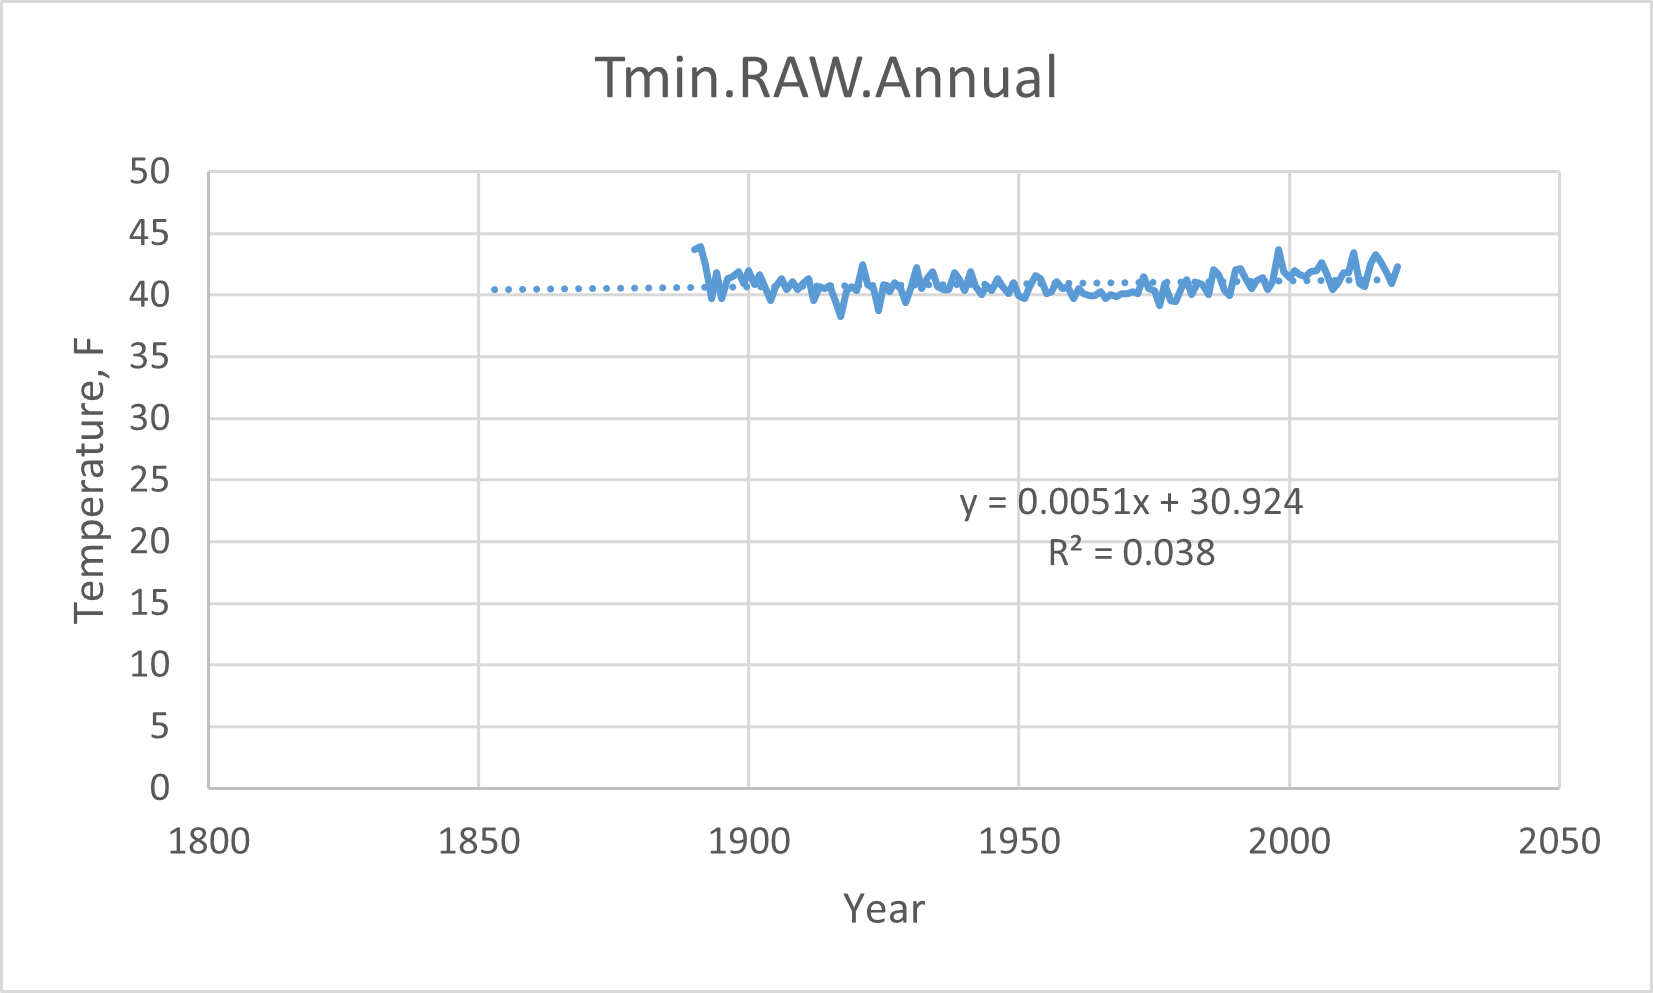
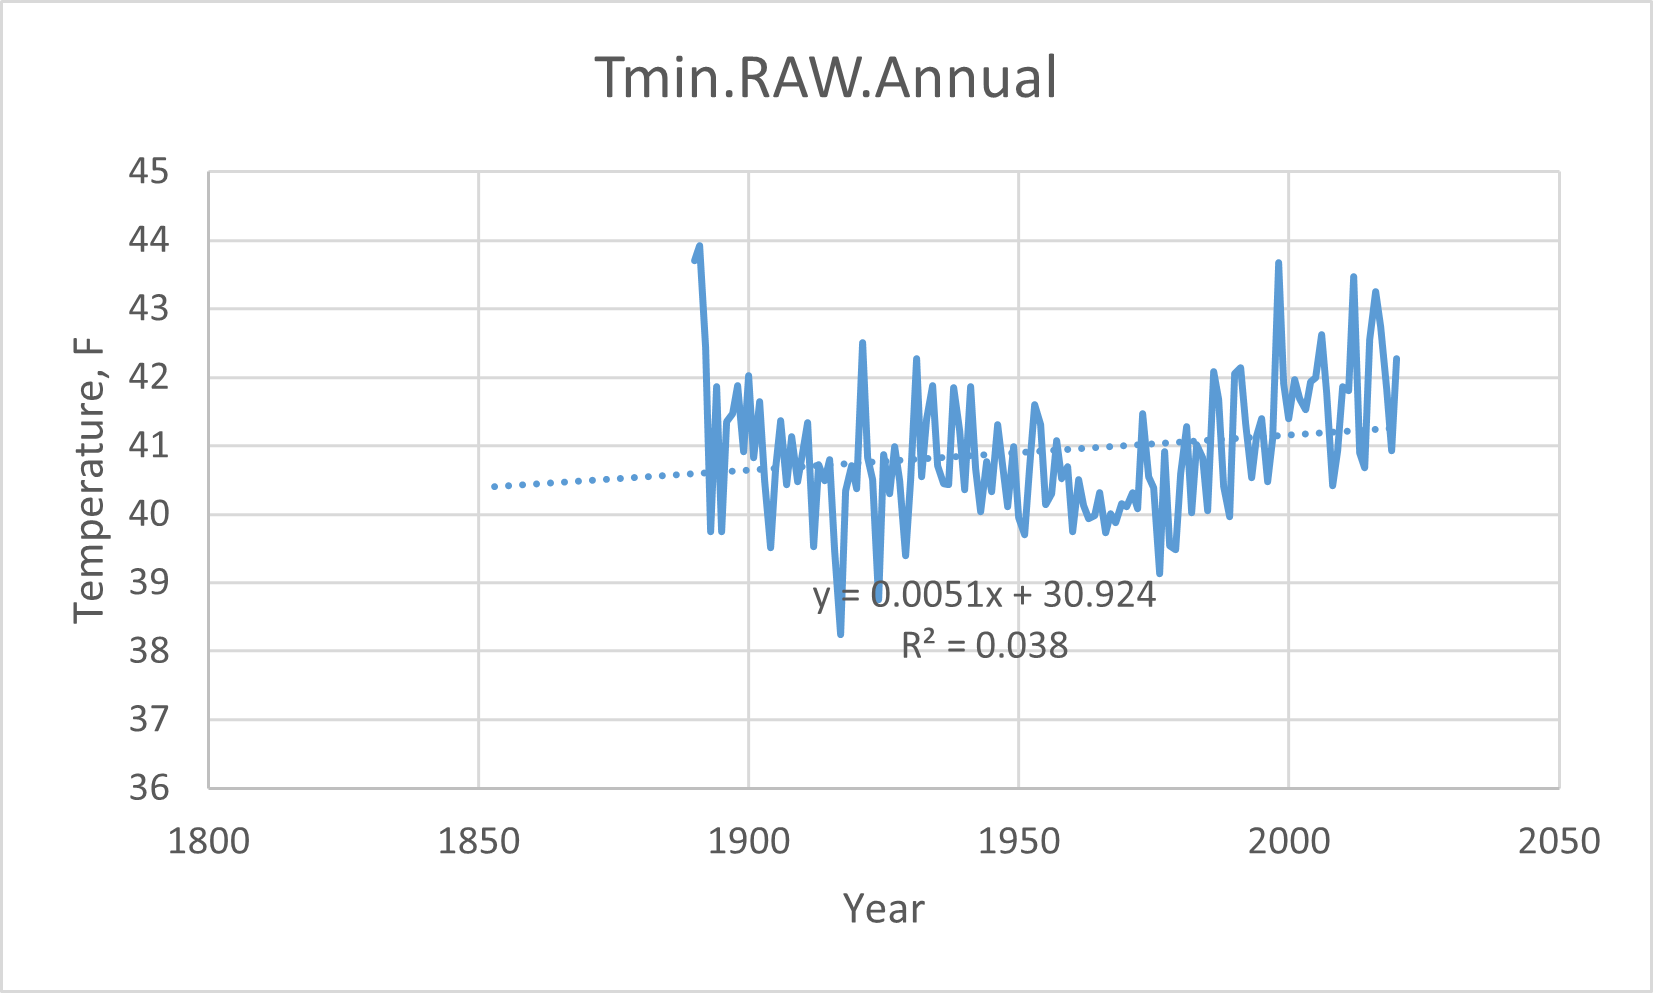
The low temperatures going up at a rate of one degree F every 200 years (one degree C every 350 years).
I probably should have bumped the cutoff up a few years, there are some big jumps at the beginning of two temperature trends.
Since the climatologists do this in degrees centigrade, so will I: averaged over the last 130 years,
- TMAX: +1 °C/500 years
- TAVG: +1 °C/820 years
- TMIN: +1 °C/350 years
So there you go. The US is warming very slowly.
You'll notice some graphs have a rising trend after 1980. Let's look into that. All the graphs show a very steady drop in the 1970's. That drop ended in 1977, and prompted the "coming ice age" scare I remember back when I was a kid. I'll use that as my starting point to calculate the trend from 1977 to 2020, the last 43 years:
- TMAX: +1 °C/6000 years
- TAVG: +1 °C/130 years
- TMIN: +1 °C/44 years
The high temperatures are flat, and the minimum temperatures are going up. The days aren't getting hotter, it's getting less cold at night! Summer days the same as they always were, and less snow and more rain during the winter. Nice! But the variability is returning to what we saw at the beginning of the 20th century. That's probably bad; I'm not sure, really.
By comparison, the last 43 years of the PHA data has:
- TMAX: +1 °C/36 years
- TAVG: +1 °C/36 years
- TMIN: +1 °C/35 years
Curious, if it was real. All the same number; an artifact of the PHA, no doubt.
And this completes the series. Thanks for reading!
That is the way of the scientist. He will spend thirty years in building up a mountain range of facts with the intent to prove a certain theory; then he is so happy with his achievement that as a rule he overlooks the main chief fact of all—that all his accumulation proves an entirely different thing.— Mark Twain'The Bee'. In What is Man? and Other Essays? (1917), p. 283
P.S. Again, this might be doable using a pivot table in Excel, but I know SQL better than I know Excel so that's the example you got.
The US Temperature Record 11: RealClimateTools.com
Tony Heller, at RealClimateScience.com, has put up a very nice data website, RealClimateTools.com, to help us look at thermometer data over the years. He is using the raw daily thermometer reports (Tmax, Tmin, Precipitation, and Snow (not sure how that's measured, daily snowfall or total depth).
You can look up the data by station and move the graph around to do a graphical selection. For example, using my closest stations, Utah Lake Lehi and Spanish Fork Powerhouse Mountain, I can look at the average Tmax before and after 1970 when the carbon-driven warming is supposed to have started.
Utah Lake Lehi Before 1970 = 62.57 average, after 1970 = 62.82
Spanish Fk Pwr House before = 65.29 average, after 1970 = 64.83
Interesting, one 0.3 degrees higher, one 0.5 degrees lower. There is a lot more variability than the conglomerated data suggests.

You can also examine the number of days above or below a certain limit by sliding the data up or down. At the Lehi station, the average number of days per year above 96 F has gone up from 3.4 to 6.0 a year after 1970. At the Powerhouse station the hottest days dropped from 20.0 to 17.7 a year.
I suspect Tony will be adding additional measuring tools over time, like trendlines, but it's fun to see the data, finally. It probably took him a lot of work to get it yup and running.
Thanks, Tony!
More Scientific Fraud Identified
Science magazine reports that a marine biologist at the University of Delaware has committed scientific fraud by making up data supporting the idea that increasing the carbon dioxide concentration in the atmosphere will increase the pH of ocean waters enough to affect the behaviors of marine wildlife. This is a big deal, because so many subsequent reports "confirm" this, in dozens of papers, while much replicating research did not. And all these reports made it into the press because they confirmed the climate change story/myth/theory. And now it's all being knocked down. The coral and the fish, it seems, are quite safe.

When these reports first surfaced I talked about them with my students, my freshman chemistry students, about the possibility that CO2 could influence the pH. Here is the problem with that idea: The carbon dioxide is part of the equilibrium. That means it can't, by definition, have any major effect whatever on the pH. Here are the reactions, with associated equilibrium constants, starting with a Henry's Law calculation at 400 ppm CO2:
(1) CO2(g) ⇄ CO2(aq) Keq = very small; [CO2] = 400 x 10-6 atm/29.41 atm M-1 = 1.36 x 10⁻⁵ M @ 400 ppm CO2
(2) CO2(aq) + H2O(l) ⇄ H2CO3(aq) Kc = 1.6 x 10⁻³
(3) H2CO3(aq) ⇄ H+(aq) + HCO3-(aq) Ka1 = 2.5 x 10⁻⁴
It is here that most climate change people stop the calculation, perhaps because at this point, and with sufficient ignorance, it appears that more CO2 means more H+ and more acidity. By combining the two equilibria into an overall equilibrium (Kc = 4.0 x 10⁻⁷) and using the concentration of CO2(aq), they get a pH addition of +1.3 x 10⁻⁵ M H+. This is a pH of 4.9. And this acidification would have been happening ever since there was carbon dioxide in the atmosphere, which is the entire life of the planet! The oceans should be totally acidified by now.
The pH of the ocean is 8.1. Which is basic. Not acidic. And adding a pH of 4.9 would make the ocean far more acidic. The failure is when they don't ask: why is the ocean alkaline? Here's why:
(4) CaCO3(s) ⇄ Ca2+(aq) + CO32-(aq) Ksp = 6 x 10⁻⁹
(5) CO32-(aq) + H2O(l) ⇄ HCO3-(aq) + OH-(aq) Kb2 = 1.8 x 10⁻⁴
Carbon dioxide acidifies, and calcium carbonate creates basic conditions, but in reality they are in equilibrium with each other, to complete the cycle with the reaction of H+ and OH- to make water:
(6) H+(aq) + OH-(aq) ⇄ H2O(l) 1/Kw = 1 x 10¹⁴
Add all the reactions together and form the equilibrium expression for the system:
(7) CaCO3(s) + CO2(aq) + H2O(l) ⇄ 2 HCO3-(aq) + Ca2+(aq) Kc = 4.3 x 10⁻⁵
with [CaCO3(s)] = 1, [CO2(aq)] = 1.4 x 10⁻⁵ M, [H2O(l)] = 1, making the concentration of the hydrogen carbonate ion dependent system dependent on dissolved carbon dioxide and calcium ion concentrations. And temperature (I haven't tried to find all that data; I've used the 25 C values):
(8) Kc = [HCO3-]2[Ca2+]/[CO2] = 4.3 x 10⁻⁵
This ignores calcium ion sinks like CaOH+, but I'll explain why in a bit.
So there is a constant source of carbon dioxide (the atmosphere), and a constant source of calcium carbonate (all the shells of living wildlife in the ocean, and their dead skeletons), and both of those also work as sinks of CO2 and CO32-. Both are in equilibrium with species which are not in the pH equilibrium (the gaseous carbon dioxide and the solid calcium carbonate). The calcium ion concentration, it seems, is the most sensitive part of the equilibrium, but it is always a very constant concentration (close to 10-4 M). So why do I discount the possible variability of calcium ion concentrations? Because it is being actively incorporated into the skeletons and shells of marine life. Active incorporation means they can drive the system toward non-equilibrium by using chemical energy, absorbing calcium in all it's soluble forms, including the CaOH+ ion. Sea-life is dependent on that calcium to build shells and marine life spends a lot of energy gathering it up. The main chemistry of the ocean is all about the calcium ion; it's the limiting reagent for marine life (well, that and phosphate ion). If life is present, the calcium concentration will be driven down to a value about 10-4 M, when more calcium carbonate dissolves, releasing hydroxide ion, which helps more carbon dioxide dissolve to provide more hydrogen carbonate ion. Ocean pH levels are all about the calcium ion concentrations. Here is a graph of the equilibrium system, taken from a soil science lecture here:
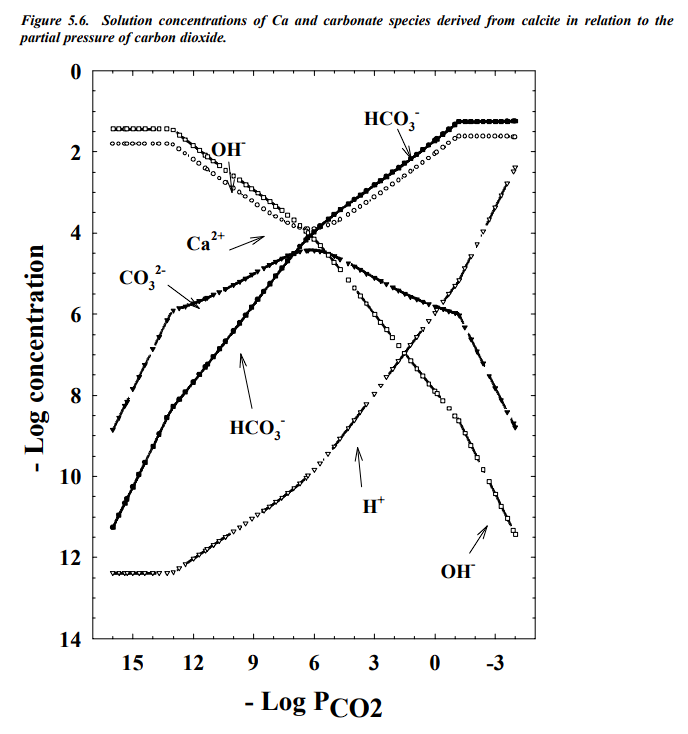
See that dip in the Ca2+ concentrations, the open circles? That dip is why the ocean pH doesn't change. Marine animals actively absorb the calcium ions to minimize its concentration, then the rest of the equilibrium system responds. When CO2 is more abundant, so are ocean plants, feeding the animals which grow, so calcium is absorbed, more calcium carbonate dissolves, and we are back to equilibrium, pH 8.1. Adding calcium ions to the water won't help, it just shifts the equilibrium momentarily to feed the animals until the ion concentrations drop back down or by precipitation of the excess calcium ions, pH 8.1. The animals are in charge of this system, so long as they absorb the calcium ions. Do anything to shift the pH, and more marine life is the consequence. It's a beautiful system.
I didn't have this graph when I explained it to my students, but I knew this is what water chemistry does with carbon dioxide and calcium carbonate both present. It's right there in the equilibrium reactions.
So the big question: why did none of these reviewers, nor the reviewers for all the dozens of papers which followed these, not pick up on this obvious consequence of equilibrium? I am utterly baffled as to why.
I've seen similar behavior in smaller studies, when spectroscopic peaks were picked from a graph that were obviously noise (papers later withdrawn from JACS and Science). Why did no one pick up on the wrongness of the interpretation? Peer review isn't this difficult. My suspicion: fraud is accepted in academia. "I'll let your paper slide into print if you let mine." It is not a beautiful system.
Once again, rely on the data, ignore the theory. Robert Boyle was right. Every damn time.
The Death of Man-Made Climate Change: the last nail is in the coffin, so why didn't it die?
Fifteen months ago a paper was published which scientifically killed the idea of man-made climate change. Kenneth Skrable, George Chabot, and Clayton French at the University of Massachusetts Lowell published (Health Physics 122(2):p 291-305, February 2022) an analysis of the NOAA carbon isotope data which has been collected since 2003. I honestly thought this research had been done dozens of times and was inconclusive. I was wrong.
The Research
The amount of carbon dioxide in the air has gone up, from 280 ppm (parts per million) in the mid-1700s to 410 pm, a 46% increase
Carbon in CO2 comes from three sources: living matter decaying to release the CO2, carbon created in nuclear reactions turning nitrogen into carbon high in the atmosphere (not very much), and carbon that we dug up and burned in air to produce energy and anthropogenic ("man-made") carbon dioxide. The carbon from those nuclear reactions always comes as the radioactive carbon-14 isotope, and it keeps the carbon in carbon dioxide at 1.1% carbon-14. Carbon from underground, since it's been there a very long time, has no more carbon-14 left; it's all carbon-12. The carbon from decaying matter is recent enough that it is also that 1.1% carbon-14. By examining the ratios of carbon-12 and carbon-14 an estimate can be made of the amount of carbon-12 added to the atmosphere by man burning fossil fuels.
It's 11.6% of the 2018 total, according to the NOAA data. Or about 48 parts per million (ppm) of the current increase of +130 ppm. One third of the increase of CO2 in the atmosphere.
Now here's the problem for the story of anthropogenic fossil fuel production of carbon dioxide causing climate change: it's gone up 130 ppm. Less than half is caused by us. Why is this a problem for man-made climate change? Because a one-third (or one-half) increase isn't enough for the climate models to produce any change, so it proves the climate models are all wrong, along with the predictions. And the bigger problem is we hear only silence where they should be explaining where the other two-thirds of the increased CO2 came from. Satisfyingly, though, it does explain why the model predictions keep not happening.
To quote the authors,
Our results show that the percentage of the total CO2 due to the use of fossil fuels from 1750 to 2018 increased from 0% in 1750 to 12% in 2018, much too low to be the cause of global warming.
To be the cause the percent must be 46%. So that's the final nail in the coffin. Any climate change we see isn't caused by fossil fuels. Attribute it to the solar cycles, to chaotic variations of weather, wherever, but it's not from fossil fuels.
But The Corpse is Still Alive
So why is global warming still a thing? That's the $1M question.
Possible reasons:
- Global warming activists (they must be called that now) don't care about science.
- Global warming activists like global warming so much they defy science to keep believing.
- Global warming activists can't, or won't, read.
- Global warming activists are in it for some other reason.
I'll address each option.
Global warming activists don't care about science.
But they do care about science, at least the science that supports their position. It's probably a form of confirmation bias. If you're not a scientist, confirmation bias can sustain a belief very well. If you are a scientist than it can't. And scientists like Michael Mann have not backed off their beliefs at all. So even when they do care, it doesn't matter. So this gets a check mark.
Global warming activists like global warming so much they defy science to keep believing.
This seems likely to me. They appear not to like the consequences, but they clearly love to talk about the disaster in the offing, and probably love feeling "right." This gets back to my previous posts and presentations about alchemy believing for 2000 years ideas which never worked: they liked the story so much it was very difficult for them to drop it. Even after alchemy was dead it took another 100 years before chemistry was being done. Very likely; big checkmark.
Global warming activists can't read.
An absurd assertion, which I reject.
Global warming activists are in it for some other reason.
Almost certainly true, given the certainty of the believers. What do they get? Money? Social status? Friends? All are strong drivers of beliefs. Huge check mark.
Does this mean we reject the global warming activists? Not really, because of all these things, none are malicious, they are just being human. We all do this stuff, supporting our beliefs for a variety of reasons, some are good beliefs, helpful to ourselves and to others; other times we believe things that harm ourselves and others, or just ourselves, or just others. But it's a human thing to do.
I have no idea how to distract them from this belief, or get them to take science seriously even when it goes against their expectation.
So I write blogs which might get read. Like the authors wrote a paper which might change the discussion. I hope that this blog helps. The authors hope their work might change the discussion. We all live in hope.

The Return of Natural Philosophy
Empiricism: using observation as the only developer of scientific theory; no need to explain why a theory is so, and a massive dose of skepticism regarding any theory and explanation; Nullius in verba "Take no one's word for it."
Natural philosophy: The belief (like a religion) that there is some purpose beneath the behavior of nature, a belief strong enough that it alters and guides observation, leading to a distrust of observation and exhaltation of the theories.
Over time mankind has swung back and forth between these two opposites.
10,000 B.C - 600 B.C.: For most of history empiricism was all we had. Practical arts and crafts, producing dyes, metals, glass and beads, pottery. Of these we have only artifacts, no written text describing any of it.
600 B.C. - 1660 A.D.: Beginning with Thales of Melitus and including all Greek philosophers, peaking at Plato and Aristotle (384 - 322 B.C.), and continuing until the formation of the Royal Society of London, everyone followed the natural philosophers. These are half mythology and half poor observation to form a description, a creation story, an all-encompassing mythology that explains why everything is as it appears, and how it came to be. Aristotle wrote books and books of his natural philosophy, and he was a good writer. His ideas were believed for millennia. And they were all wrong. Flies have eight legs. Horses have 24 teeth. Men have more teeth than women. Metals are made in the earth through the combination of moist and dry vapours. All wrong. But he made a good story of it, and that story was enough. We love a good story, and remember them. So people remembered his good stories.
1536: Petrus Ramus (Pierre de La Ramée, or just Peter Rami) writes a dissertation Quaecumque ab Aristotele dicta essent, commentitia esse (Everything that Aristotle has said is false), for which he is later killed by an Aristotelian Catholic. But someone has finally said it.
1660: Robert Boyle and his friends, who style themselves the Invisible College (because they are in a pub, not a college) and some faculty from Gresham College form the Royal Society of London to produce fact. This is a pivotal moment in the development of science, because they want desperately to get away from natural philosophy and back to reality. The Society is there to host experimenters and witnesses to establish clear fact; the register cannot be signed unless the experimenter can say in a short phrase what fact he has demonstrated. The motto of the Society: Nullium in verba, "take no one's word for it." This motto is a clear statement of the empirical way of science: "I'll never take your word for anything; you must demonstrate fact, and I'll trust that if I (or someone I trust) observes, but anything else you say doesn't matter, I can draw my own conclusions." This motto presupposes that we have read and experienced enough to make sense of the demonstrated fact. If not, have another beer and don't get into science.
1950: After special relativity, general relativity, and quantum theory began to settle on the minds of scientists, they were drawn back to the natural philosophy as an explanation. Reasonably, I think, because those are such difficult concepts to master and stories help in understanding them. In 1950 Edwin Schrödinger (quantum theory) and Albert Einstein (both relativities) wrote letters back and forth trying to work out the empirical nature of quantum theory. They were dealing with one main question: can a quantum effect have any impact on reality? Together they come up with an apparatus that uses a quantum effect (a 50% probability effect, the decay or non-decay of a single radioactive atom) which will cause a detector to trigger a mechanism that will kill a cat (the observable reality). This is what Schrödinger's Cat is all about. They arrive at no conclusion, other than to demonstrate the silliness of the superposition aspect of matrix mechanics and the vast preference for Schrödinger's wave mechanics. But alas, the damage was already done: natural philosophy could not be stopped by some letters.
We are back in the age of natural philosophers. Natural philosophers don't spend much time in observation, they tell others what should be happening. That's an important word, should. It's a moral word, not describing nature, but describing how we anticipate what will happen. Predictions are an important part of what you do with observations. Successful predictions indicate we have observed accurately and have done well in describing them. Shoulds work differently. Since the should is believed, any violation of the expectation is wrong, and wrong data can easily be ignored or modified to make it conform to the should. I see far too much "science" being done this way, certainly everything leaning into propaganda. Antinuclear, climate change, organic, eating bugs, fossil fuel use come immediately to mind. None of it supported by empiricists, but by natural philosophers, particularly when they make it out to those talking to the public, the activists. They are pure natural philosophers.
Mototaka Nakamura, a climate scientist for 25 years, realized in 2019 that they weren't doing science anymore when they modeled the climate and made their predictions. He wrote it up in Confessions of a Climate Scientist: The Global Warming Hypothesis is an unproven Hypothesis, published on Kindle ($0.99 at the time of writing, in Japanese with an English version embedded within). From 1990 - 2014 he worked on the driving mechanisms for medium-scale, large-scale, and planetary-scale flow in the atmosphere and oceans (mass and heat, mostly). He realized the importance of nonlinear fine-scale phenomena in large-scale processes that weren't being modeled, like the dynamics of cloud formation. He became skeptical of the "global warming hypothesis" because of the catastrophic predictions, not the measured temperatures, which he says remains at 0.5 degrees K higher in 2019. He thesis: "I am simply pointing out the fact that that it is impossible to predict with any degree of accuracy how the climate of the planet will change in the future." He attributes this impossibility to not knowing how the solar input will change, nor how man-made carbon dioxide output will change in the future. In other words, it's the non-measurable part of the model that bothers him. A lot. He is bothered by the lack of good data for global weather, using instead the limited regional weather (America, Europe, and India) as representative of the globe, when we have strong evidence that regional changes do not follow global patterns. So in the absence of empirical data, climate scientists have created theories (models; Nakamura calls them hypotheses) to do all the explaining, then trust those models above the empirical data. Climate scientists have become pure natural philosophers again, and like Aristotle, everything they say is wrong. Nakamura's short book is a good read on where the climate modeling fails, the largest being solar energy input and the total unpredictability of cloud cover. The author has left climate science, with this book accounting for what climate science is doing his last climate activity.
Scientific papers generally have four sections: introduction, experimental, results, and discussion. A hundred years ago the discussion section was the shortest by far. Now in every paper I read it is the longest, sometimes by far. It is the discussion section the Royal Society said not to trust. I think it can be thrown away; if the experiment is so poorly done and reported that the reader can't figure out by themselves what it means, then don't publish until it's done right. Subtle, difficult, needed-to-be-argued science isn't good science, it's propaganda for the authors lab. For heaven's sake don't publish that crap.
If the experiment is so poorly done and reported that the reader can't figure out by themselves what it means, then don't publish until it's done right. Subtle, difficult, needed-to-be-argued science isn't good science, it's propaganda for the authors lab.
Long live empirical science! Maybe this climate science thing will reveal the flaws and start a movement back to pure empiricism.
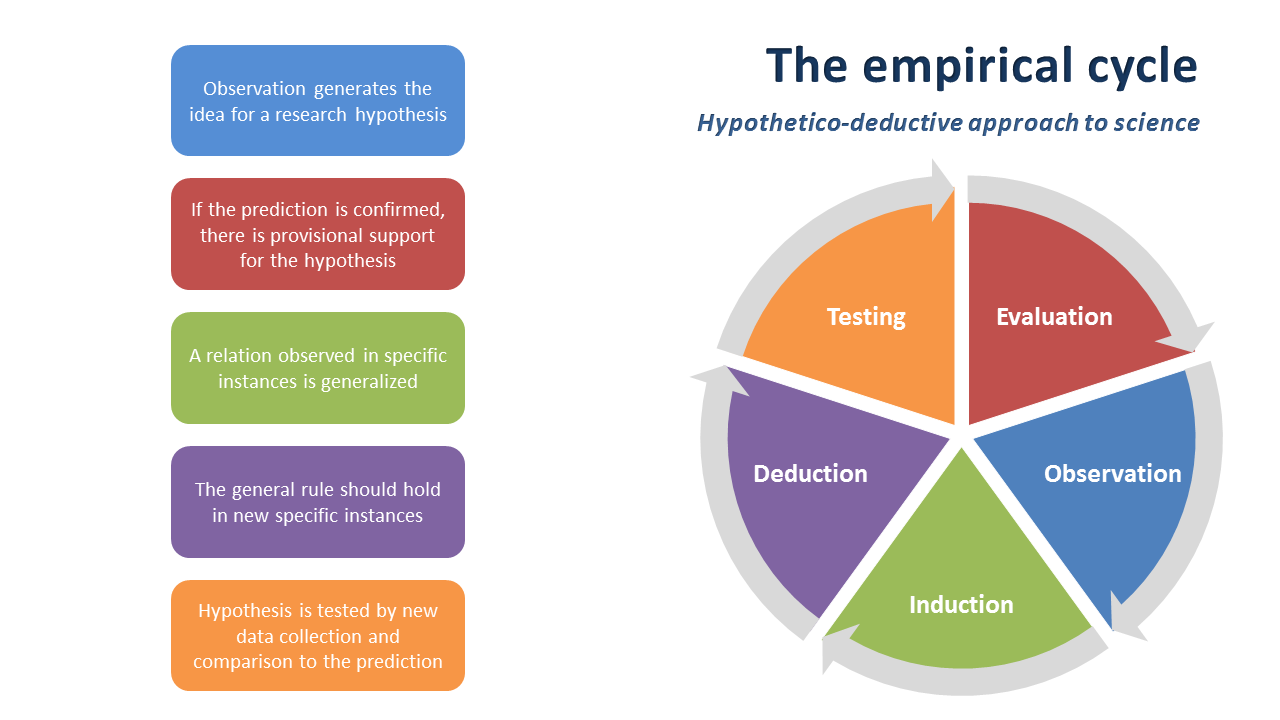
The Stupidity of the Climatists
One primary method of being stupid is to do things that bring you to a state opposite of your intentions. Like wanting higher crop yields so you kill all the birds that eat seeds, and discover that they also eat the bugs that consume the crops so in the end your yields plummet. Then doing it again the next year. Brought to you by the idiots running of Maoist China.
We have the same thing happening in the climate change crowd.
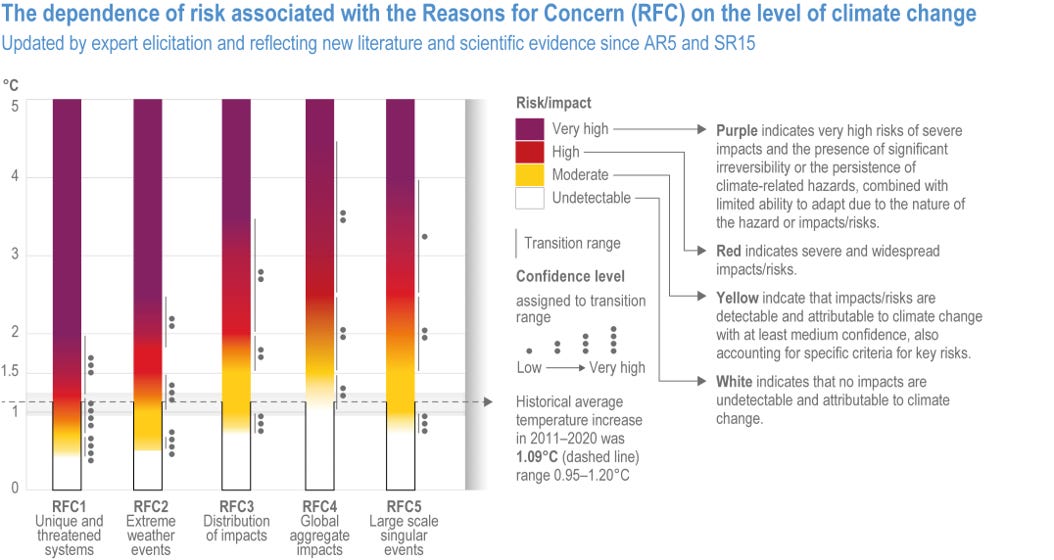 IPCC AR6 WG2 FAQ16.5.1
This is a "burning ember" diagram. Nothing about it is based on observation. It's all speculation, with colors chosen to scare you. This particular working group has five "reasons for concern." Four of them presumably affect the quality of life for humans, by killing them. And the recommendation for mitigating these events? Restrict energy production and availability.
Here's the problem: if quality of life is the goal, we know well how to accomplish that: cheap and available energy. We've known that since the mid-1800s as the driver of the industrial revolution. So why destroy a guaranteed huge driver of quality of life to avoid the low-confidence possibility of bad events? Because climatists are stupid. From the best intentions they will hurt you and themselves, and keep doing it.
Climatists are the followers of an ideology that the weather of the late 1800s was perfect, even though they can't tell you what that weather actually was, and that it must be attained at any cost.
Here is my list of the three most important things that affect the quality of life, some not so proven:
- Having two parents of opposite gender, so there is enough care for the kids and examples of both male and female behaviors to emulate. This is very visible in social surveys.
- Having available and inexpensive energy.
- Having a robust capitalist economy with little regulation.
Missing from the list: giving power to idiots who have it backwards. For example, NOAA, tracking the weather, finds that heat kills 134 people a year, while cold kills 30. But the CDC, who track deaths, not storms, has cold killing 1300 a year, while heat kills 670. So if lower weather-related mortality is the goal, higher temperatures are desired over lower. But what else would you expect from the people who said, "Hey, let's not use thermometers which have been in place for 150 years to measure the temperature, let's measure it from 200 miles away, from space!" Keep them away from policy!
Vikek Ramaswami is right, "Burn, baby, burn!"
EDIT (Feb 2024):
I found a quote from Ross McKitrick on the topic:
I abhor Earth Hour. Abundant, cheap electricity has been the greatest source of human liberation in the 20th century. Every material social advance in the 20th century depended on the proliferation of inexpensive and reliable electricity. Giving women the freedom to work outside the home depended on the availability of electrical appliances that free up time from domestic chores. Getting children out of menial labour and into schools depended on the same thing, as well as the ability to provide safe indoor lighting for reading. Development and provision of modern health care without electricity is absolutely impossible. The expansion of our food supply, and the promotion of hygiene and nutrition, depended on being able to irrigate fields, cook and refrigerate foods, and have a steady indoor supply of hot water. Many of the world's poor suffer brutal environmental conditions in their own homes because of the necessity of cooking over indoor fires that burn twigs and dung. This causes local deforestation and the proliferation of smoke- and parasite-related lung diseases. Anyone who wants to see local conditions improve in the third world should realize the importance of access to cheap electricity from fossil-fuel based power generating stations. After all, that's how the west developed.
The whole mentality around Earth Hour demonizes electricity. I cannot do that, instead I celebrate it and all that it has provided for humanity. Earth Hour celebrates ignorance, poverty and backwardness. By repudiating the greatest engine of liberation it becomes an hour devoted to anti-humanism. It encourages the sanctimonious gesture of turning off trivial appliances for a trivial amount of time, in deference to some ill-defined abstraction called “the Earth,” all the while hypocritically retaining the real benefits of continuous, reliable electricity. People who see virtue in doing without electricity should shut off their fridge, stove, microwave, computer, water heater, lights, TV and all other appliances for a month, not an hour. And pop down to the cardiac unit at the hospital and shut the power off there too.
Activist Science
A short post today: What is the difference between an activist scientist employed by an agency and a commercial employed by a business?
One needs to be amazing to keep their job, the other has to be right to keep their job.
So which science do you trust?
Looking for a nice image to go here, I found this. When 2200 members of the Union of Concerned Scientists Science Network were asked "how often should scientists be politically active in their professional activities?", an astounding 0.9% said "never." 99.1% thought activism should be part of their professional activities. So in my mind, 99.1% of them produced junk science because they are motivated by the wrong thing: changing the world to what they want.
Scientists measure the world as it is; when alternative motivations enter, they measure the world by what they want to to be. It explains all the fiddled thermometer data, all the bad graphs, all the nonsensical conclusions. All the junk science.
Activism produces crap. It becomes propaganda for the stupids.
Corporate science is driven by reality: goof up the science and you goof up the company profit margin, and out you go. Corporate scientists need to be firmly anchored in reality. Though there is the possibility that by lying the corporate scientist will support a higher profit margin, few companies will risk the devastating exposure of science fraud. It has been risked, and discovered, and industries hit hard in the aftermath. But I trust corporate science way over all other types of science.
What of academic science? Were it not for the old professors, and the young professors, and the post-doctoral scientists, and the graduate students, and the undergraduates, I'd trust it. Old professors are ossified with old ideas, and don't really develop new science. They concentrate on reinforcing their own early ideas which weren't accepted. Young professors need rank advancement, and the university public relations office needs fodder to brag on, so they'll take any overblown claim as fact. Postdocs and graduate students need a career job, and the more noteworthy they are the better position they'll get. Fraud is blamed on the major professor, so they can get away with fraud, and being highly incentivised to commit fraud, they frequently do. And undergraduate scientists are just clueless.
So who in academia can do good science? I don't know, and good science is rare here.
So who do I trust most: corporate science. By far.
Everyone else, especially the activist scientist, reminds me of this kid, wearing his safety googles on his forehead. An enthusiastic effort, but doing it wrong.